Skip to content

UCAS: big differences between UK nations in applicants’ success rates to date

With the final daily clearing bulletin from UCAS issued last Friday, it’s possible to  see some emerging patterns in UK university admissions for 2015.   Further students will be admitted over the next few weeks and the numbers will still alter, but significant further changes are now unlikely.

The availability of places and the portability of student funding in each UK nation is clearly exercising a strong influence. While 82% of applicants from Wales are able to benefit in full from  their government’s student funding policies, only 42% of those from Northern Ireland are in that position (the equivalent figure is 63% for students from Scotland; 80% for those from England).

Success rates

For some years now,  acceptance rates for students from Scotland and Northern Ireland have lagged behind those for Wales and England (fig 11 here).  That looks set to continue.

The table below shows the total number of applicants from each UK nation by the end of June, compared with the number of students who were placed by last Friday.  For Scotland and Northern Ireland roughly 2 out of 3 applicants had been placed: for Wales and England it was around 4 in 5.  The percentages in all cases can be expected to rise a little further over the next few weeks, but not that dramatically.  These figures cover students admitted to a place anywhere in the UK: more below on why that’s not the whole story.

England Northern Ireland Scotland Wales
Applicants by 30 June 460,640 20,680 44,510 23,540
Placed by 28 August 366,290 13,880 29,610 19,210
% placed 79.5% 67.1% 66.5% 81.6%

Source UCAS: Application data here; data on placed applicants here.

Growth in supply vs demand

At the same time, numbers placed are growing much faster than numbers applying for Wales and England;  for Scotland, the number placed is growing somewhat faster than applications this year; while for Northern Ireland, the number placed  has actually dropped, while applications from there have risen faster than anywhere else in the UK. Uniquely in the UK, in Northern Ireland this year  the number of new funded places available  has contracted, as a direct result of financial pressures on the Northern Irish budget feeding through into university funding. What’s happening in Northern Ireland really deserves more attention.

England Northern Ireland Scotland Wales
Change in apps by end June 0.80% 1.90% 1.70% 0.40%
Change in placed students by 28 Aug 3.00% -2.70% 2.50% 2.10%

Source: UCAS.  Applications as above; individual country analysis for placed students on 28 August here (using like-for-like figures provided excluding X1 applicants for Scotland)

Some of the Scots not successful through UCAS may go on to take up an HN-level course in an FE college, bypassing UCAS.   One of the great unresolved issues in cross-UK comparisons is how and when to count in Scotland’s much larger population of sub-degree students studying in FE colleges, who are drawn disproportionately from more disadvantaged backgrounds. UCAS figures remain however  a reasonable basis for comparing entry to degree-level HE in universities across the UK.

Home or away?

One further issue for Scotland and Northern Ireland is how many students are given a place in their home nation.  Welsh and English students face no difference in cost by traveling over an internal UK border, as all their subsidies are fully portable.  By contrast, Scottish students leaving Scotland face a sharp difference in fee costs (zero versus up to £9,000 supported by a fee loan).  Northern Irish students similarly see a rise in borrowing,  to fund a fee of  up to £9,000 elsewhere in the UK, against only £3,805 at home.

The percentage of applicants successful in their home nation is lower again in both cases, particularly so for Northern Ireland. There has been a 10% drop in the number of home students placed in NI: it is only because of a surge of students taking up places in the UK (mainly England)  that there has not been such a sharp fall in Northern Irish students placed by UCAS overall.

Northern Ireland Scotland
Placed in home nation 8740 27940
% of all apps 42% 63%

Even in Scotland, from where smaller numbers leave, it remains worth wondering about the limitations of free university tuition as a policy, if almost two out of five of those seeking a university place can’t get it. A piece in yesterday’s Scotland on Sunday made much this point.

What’s enabling the increase in places?

Related to that, most of the growth in Scots with places this year appears to be accounted for either by students going elsewhere in the UK or reduced pressure from EU students.

Students going to other parts of the UK account for just under one-fifth of the growth.

2014 2015 Increase
Placed in rUK 1,540 1670 130 (8.4%)
Placed in Scotland 27,350 27940 590

(2.2%)

Source: UCAS as above

At the same time, a drop of 260 in the number of EU students so far placed in Scotland (also entitled to Scottish Government funded places) has relieved some pressure in the system. If EU student numbers had held steady and thus taken up more funded places, the increase for Scottish students this year would have been a whole percentage point lower, at around 1.5% – supply would not have grown as fast as demand.

This disaggregation won’t be precise: some courses recruited through UCAS, such as the postgraduate LLB, are not publicly funded. Nevertheless there are strong indications here of a system which is relying quite heavily on out-of-country expansion and reduced EU pressure to meet growing demand from home students.

Footnote: where next?

The remit for the Widening Access Commission says that “the Government’s ambition is that a child born today in one of our most deprived communities should, by the time he or she leaves school, have the same chance of going to university (sic) as a child born in one of our least deprived communities”.  In that case, at some point there will have to be either a radical reduction in participation levels at the top, or a large expansion of opportunity well beyond what can be achieved through exporting more of our young people or putting off students from elsewhere in Europe.  That won’t come cheap.

EMA in Scotland: a case study in getting political value for money

An increase in the income threshold for EMA reported today confirms that politics of the traditional sort are alive and well in Scotland.

At a public Cabinet meeting in Oban yesterday, the First Minister announced that the income threshold for EMAs is to be increased by around £4,000 and eligibility extended to those in part-time FE.

Or rather, she re-announced it: the extension of EMA to more people was highlighted in the FM’s speech to the party conference in March, as discussed here.  None of the reporting notices this.  The only new part of the announcement is that precise figures are now being put on the increase in the income threshold and on the cost (£16m, as predicted here in March).

This sort of re-tread announcement is not unusual by governments in any period or part of the UK.  The double hit on this one stands out for three reasons, the first two of which were discussed in this earlier post.

First, there was a large cut in EMA spending in 2009-10 (when the current First Minister was Deputy First Minister). That year the SG abolished a £20 weekly payment previously available at incomes up to £26,769 and a £10 payment at incomes up to £32,315.   In 2010-11, a bonus payment was removed, which saved around £6m. The remaining weekly amount for EMA (£30) has remained unchanged since 2004, when it was first introduced,  eroding its the real terms value significantly.   At current prices, spending on EMAs in 2008-09 would now be worth around £40.4m.  For the latest year for which we have figures (2013-14) it was £28.2m.  So most of the £16m is simply making up lost ground.

Second, the funding for this seems to be coming from the cash removed in-year from university budgets.  The  Scottish Government made a politically important claim in 2013 that Scotland was the only part of the UK increasing its grant to universities. However, the £21m the SG has told the Funding Council to hold back from universities this year is enough to mean that is no longer the case. So this money has been worked hard politically, parked long enough in the budget for universities to serve one purpose, before being moved (outside the budget process) to be announced (twice) in another area.

Third, the new threshold is one also used for FE bursaries. Yet a link to the FE bursary threshold was first announced in 2009-10.  It turns out that as the FE threshold has risen, the one for EMAs has remained frozen.  So the reason the FM is able to announce an increase of some £4,000 now is because the government hadn’t increased this threshold at all for six years.

The EMA increase takes effect in January.  That seems a lost opportunity if the aim was to encourage people to stay on in education: the academic year starts now and there’s been 6 months since the initial announcement to get something in place for that.

The delayed start will keep the cost down in the current year, so  the universities may yet see some of their money back.  However, with the student support budget held flat, but student numbers rising, there must be a reasonable possibility that some of the money held back from universities will be needed to plug a gap there.  Indeed, the delayed start to the rise in the EMA threshold may have as much to do with emergency calculations about the SAAS budget as political calculations (the next Scottish Parliament elections are in May).

As a final point,  following this change and despite all the political priority attached to widening access to higher education, there are now a few students who will see their entitlement to grant funding fall by more than one-half when they move from school into higher education (they are those with family incomes of £24,000 and just over, whose £500 grant is equal to only £13 a week, over 39 weeks). If any of the affected students are part of the large minority of the poorest students who choose not take out loans and try to manage on the grant alone, they will find that going to university leaves them poorer than before.  Also, bringing in part-time FE to EMAs leaves part-time HE as the only post-school option  attracting no living cost support at all.  That now looks very odd indeed.

This announcement therefore reinforces the need for a more coherent approach to student funding policy.  Once the various systems for EMAs, FE bursaries and HE bursaries and loans are put alongside each other, at any given income there’s significant variation in what’s available, and even what is guaranteed (FE bursaries are first come, first served). This is not a new phenomenon:  it was recognised as an issue requiring attention  more than a decade ago.  However, since then the fascination with fee policy for those in full-time higher education appears to have absorbed most of the political attention in government.  Funding for living costs in Scotland in the past few years has instead been characterised by ad hoc initiatives and announcements, freezes and cuts quietly made and then more loudly restored in whole or part. Less headline chasing and more strategic policy-making would serve the poorest students better.


A bit more evidence on the link between graduate employment and the socio-economic mix of institutions’ intake

Further to this earlier post, a bit more evidence on the link between intake and employment prospects.

This author does not have direct access to institution-level figures on graduate employment. However they were used back in May by the Guardian to compile its annual UK university league tablediscussed in this earlier post.

Setting the HESA data on intake from NS-SEC 4-7 against this shows a pretty clear pattern within Scotland, with graduate employment improving as the percentage from more advantaged socio-economic groups rises.  There are trend-buckers – most obviously Robert Gordon, perhaps reflecting the range of courses and business partnerships there.    But once RGU is excluded, the top five universities for graduate employment prospects are also the five with the highest intakes from the most advantaged backgrounds.  The same pattern holds at the bottom of the table.  If there’s a correlation between the social advantage of the intake and employment prospects within Scotland, it seems a reasonable thesis that the same is true between parts of the UK.

This table below sorts institutions in order of “career after 6 months” and sets this against the percentage of young entrants in the relevant year not from NS-SEC 4-7, derived by taking the HESA data for NS-SEC 4-7 and subtracting that from 100%.

Institution Career after 6 months: UK ranking in Guardian league table 2015 % f/t young entrants 2010 NOT from NS-SEC 4-7 2010
Robert Gordon 81.8 64.9
Glasgow 79.8 80.9
St Andrews 78.5 85
Edinburgh 78.2 82.9
Strathclyde 77.5 72.8
Aberdeen 75.0 75.3
Heriot-Watt 72.7 69.8
Dundee 71.2 72.1
Stirling 70.2 71.7
Glasgow Caledonian 67.1 66.1
Queen Margaret 63.7 70
Abertay Dundee 61.7 64.2
Edinburgh Napier 61.3 70.3
West of Scotland 58.4 62.8


Footnote:

The Guardian explains its employment measure like this:

h. Career prospects

The employability of graduates is assessed by looking at the proportion of graduates who find graduate-level employment, and/or study at an HE or professional level, within six months of graduation. Graduates who report that they are unable to work are excluded from the study population, which must have at least 25 respondents in order to generate results.

Graduate employment and Scotland/UK comparisons: less of a case for celebration than first appears?

Perhaps prompted by yesterday’s report from the CIPD, Universities Scotland tweeted today about graduate employment levels in Scotland and including comparisons with the UK.

The two sets of figures highlighted are:

73% of Scottish university graduates going straight into work secure graduate level jobs (UK avg 68%) (here)

89.9% of Scottish university graduates are in positive destinations of work or further study (UK average 88.8%) (here)

A question prompted by comparisons of post-graduation employment is how far this may reflect differences in the social background of the graduates leaving university in different parts of the UK. There is research to suggest (not very surprisingly) that employment success after graduation has a relationship with social background on entering university: for example, this recent report from the Social Mobility and Child Poverty Commission.  So any university system which had a  more socially selective student population would be expected to have better post-graduation employment rates.

Could UK/Scotland comparisons be affected by this?  The graduate employment figures from HESA quoted cover all UK and EU students,  so any analysis for comparative purposes needs to look at that whole group, not only those from Scotland.   The 73% quoted above is for former full-time students, so again any comparison of intake might be reasonably limited to those. For both Scotland and the UK, the figures only cover HEIs, so HE in FE colleges can be ignored for this purpose.

The relevant group for the June 2015 stats will be 2014 leavers, who mostly started university in 2010 or 2011, so HESA’s “performance indicators” on access for new full-time entrants in those years is a good place to look: see here.  Those figures give percentages for the UK and for Scotland for students (a) from state schools and (b) from National Statistics Socio-economic (NS-SEC) classes 4 to 7 (see footnote 2).  The PIs only cover young students, but it would take a large inter-country difference in the profile of full-time older students to change the general picture, so these are at least a good place to start.

The figures suggest that  the difference in post-graduation employment rates between Scottish HEIs and the UK as a whole may be explained in whole or part by differences in intake.  In these years Scotland took a slightly lower share of its students from state schools than the UK as a whole and there was a larger gap still in the proportion of students entering HEIs from NS-SEC classes 4 to 7.  The differences are pretty similar to differences in graduate employment outcomes.

Full-time young degree entrants (Tables T1a)

2010-11 2011-12
State school entrants % Scotland 88.3 87.9
UK 88.7 88.9
NS-SEC4,5,6,7 % Scotland 27.2 26.6
UK 30.6 30.7


The purpose of this post is not to discourage Scottish universities from celebrating the success of their graduates in finding work.  However, the comparison with UK employment rates is regularly used by Universities Scotland and by Scottish Ministers (for example, here)  to imply the Scottish system works better for students.  Before these comparisons are used again, the ball is in the court of universities and government to demonstrate that slightly better employment outcomes here than in the UK as a whole aren’t accounted for in large part by a slightly more socially advantaged intake.


If there are more sophisticated deconstructions available of differences between different parts of the UK which look at how HEI intake affects graduate employment, I’d be happy to update this post to include links to any that readers want to highlight.


Footnote 1:

HESA summarised the figures in June as below:

Key Points – Scotland HEPs only

In 2013/14, there were 35,680 leavers from HEPs in Scotland whose destinations were known (34,860 in 2012/13). Of these, 64% (22,965) were in UK employment (64% in 2012/13), 5% (1,625) were employed overseas, 6% (2,115) were in work and further study, 15% (5,340) were in further study, 5% (1,770) were engaged in other activities and 5% (1,860) were unemployed (6% in 2012/13). (Ref. Table 2a [xlsx 21 KB], Table 3a [xlsx 21 KB] and Chart 9.)

In 2013/14, there were 20,740 full-time first degree leavers whose destinations were known (20,555 in 2012/13), 65% (13,490) were in UK employment (64% in 2012/13) and 6% (1,160) were unemployed (6% in 2012/13). (Ref. Table 2a [xlsx 21 KB] and Chart 9.)

For Science subject areas 70% of full-time first degree leavers were in employment (either in the UK or overseas) and 5% were unemployed. For other subject areas 66% were in UK or overseas employment and 6% were unemployed. (Ref. Table 4a [xlsx 44 KB].)

In 2013/14, of the full-time first degree leavers who were employed in the UK, 73% were in posts classified as Professional employment (69% in 2012/13). The remaining 27% were working in occupational groups classed as non-professional. (Ref. Table 5a [xlsx 28 KB].)

In 2013/14, of the 1,800 part-time first degree leavers whose destinations were known, 77% (1,385) were in UK employment and 3% (45) were unemployed. (Ref. Table 3a [xlsx 21 KB] and Chart 9.)

Of the 3,865 other undergraduate leavers (both full-time and part-time, excluding foundation degree) whose destinations were known, 42% (1,645) were in UK employment. Of the 8,455 other postgraduate leavers (both full-time and part-time, including Postgraduate Certificate in Education) whose destinations were known, 69% (5,860) were in UK employment and a further 9% (770) were employed overseas. (Ref. Table 2a [xlsx 21 KB], Table 3a [xlsx 21 KB] and Chart 9.)

In 2013/14, of those UK domiciled, first degree leavers (both full-time and part-time) reported as being in full-time paid employment in the UK, 62% disclosed their salary. The median salary reported (to the nearest £500) was £22,000. The lower quartile was £18,000 and the upper quartile £26,000. The mean salary was £22,500. (Ref. Table 6a [xlsx 17 KB].)


Footnote 2:

HESA explains that

The information on socio-economic classification is taken from the National Statistics Socio-Economic Classification (in technical terms, HESA field SEC). The classifications used are:

1 Higher managerial and professional occupations
2 Lower managerial and professional occupations
3 Intermediate occupations
4 Small employers and own account workers
5 Lower supervisory and technical occupations
6 Semi-routine occupations
7 Routine occupations

The UK performance indicator is the proportion of students from NS-SEC classes 4 to 7 out of those from NS-SEC classes 1 to 7. NS-SEC class 8, long-term unemployed or never worked, has been included with unknown classification for the purposes of the UK Performance Indicators.

For the 2008/09 academic year, UCAS changed the question that informs NS-SEC which affected the majority of applicants for entering in the 2008/09 academic year. The question reverted back to the original wording for 2009/10 applicants.

For applicants up to and including the 2007/08 academic year and for the 2009/10 academic year, UCAS asked:

“If you are under 21, please give the occupation of your parent, step-parent or guardian who earns the most. If he or she is retired or unemployed, give their most recent occupation. If you are 21 or over, please give your own occupation.”

For applicants for 2008/09 entry, the question changed to:

“If you are in full-time education, please state the occupation of the highest-earning family member of the household in which you live. If he or she is retired or unemployed, give their most recent occupation. If you are not in full-time education, please state just your own occupation.”

The change in question had an impact on the NS-SEC indicators, causing the proportion of students classified as unknown and those classified as falling into NS-SEC groups 4 to 7 to rise in 2008/09. Although the question reverted back in 2009/10, there may still be a slight impact on the NS-SEC indicators resulting from applicants who applied using the 2008/09 form and deferred entry. Given these differences and the lack of any significant external changes to the system, it is safe to conclude that the change in question means that the NS-SEC data for 2008/09 is not comparable with that published prior to and post 2008/09. The 2008/09 NS-SEC data has been labelled as age-adjusted NS-SEC and it is not recommended to include this data in any time series analysis. As a result, the 2008/09 NS-SEC data has been published separately in tables T1ai, T1bi and T1ci and labelled as age-adjusted NS-SEC.

Over-qualification and skills mismatch in the graduate labour market: CIPD report August 2015

The Chartered Institute of Personnel and Development has just issued a report arguing that the UK has a particularly high proportion of graduates in non-graduate jobs and that this figure has increased over the past decade.

http://www.cipd.co.uk/publicpolicy/policy-reports/overqualification-skills-mismatch-graduate-labour-market.aspx

The annual graduate employment statistics remain much-emphasised by universities and government.  Providing an alternative, more sceptical view this report is worth a bit of attention: it will be interesting to see what counter-arguments are put to this and by whom.  The Guardian report notes that:

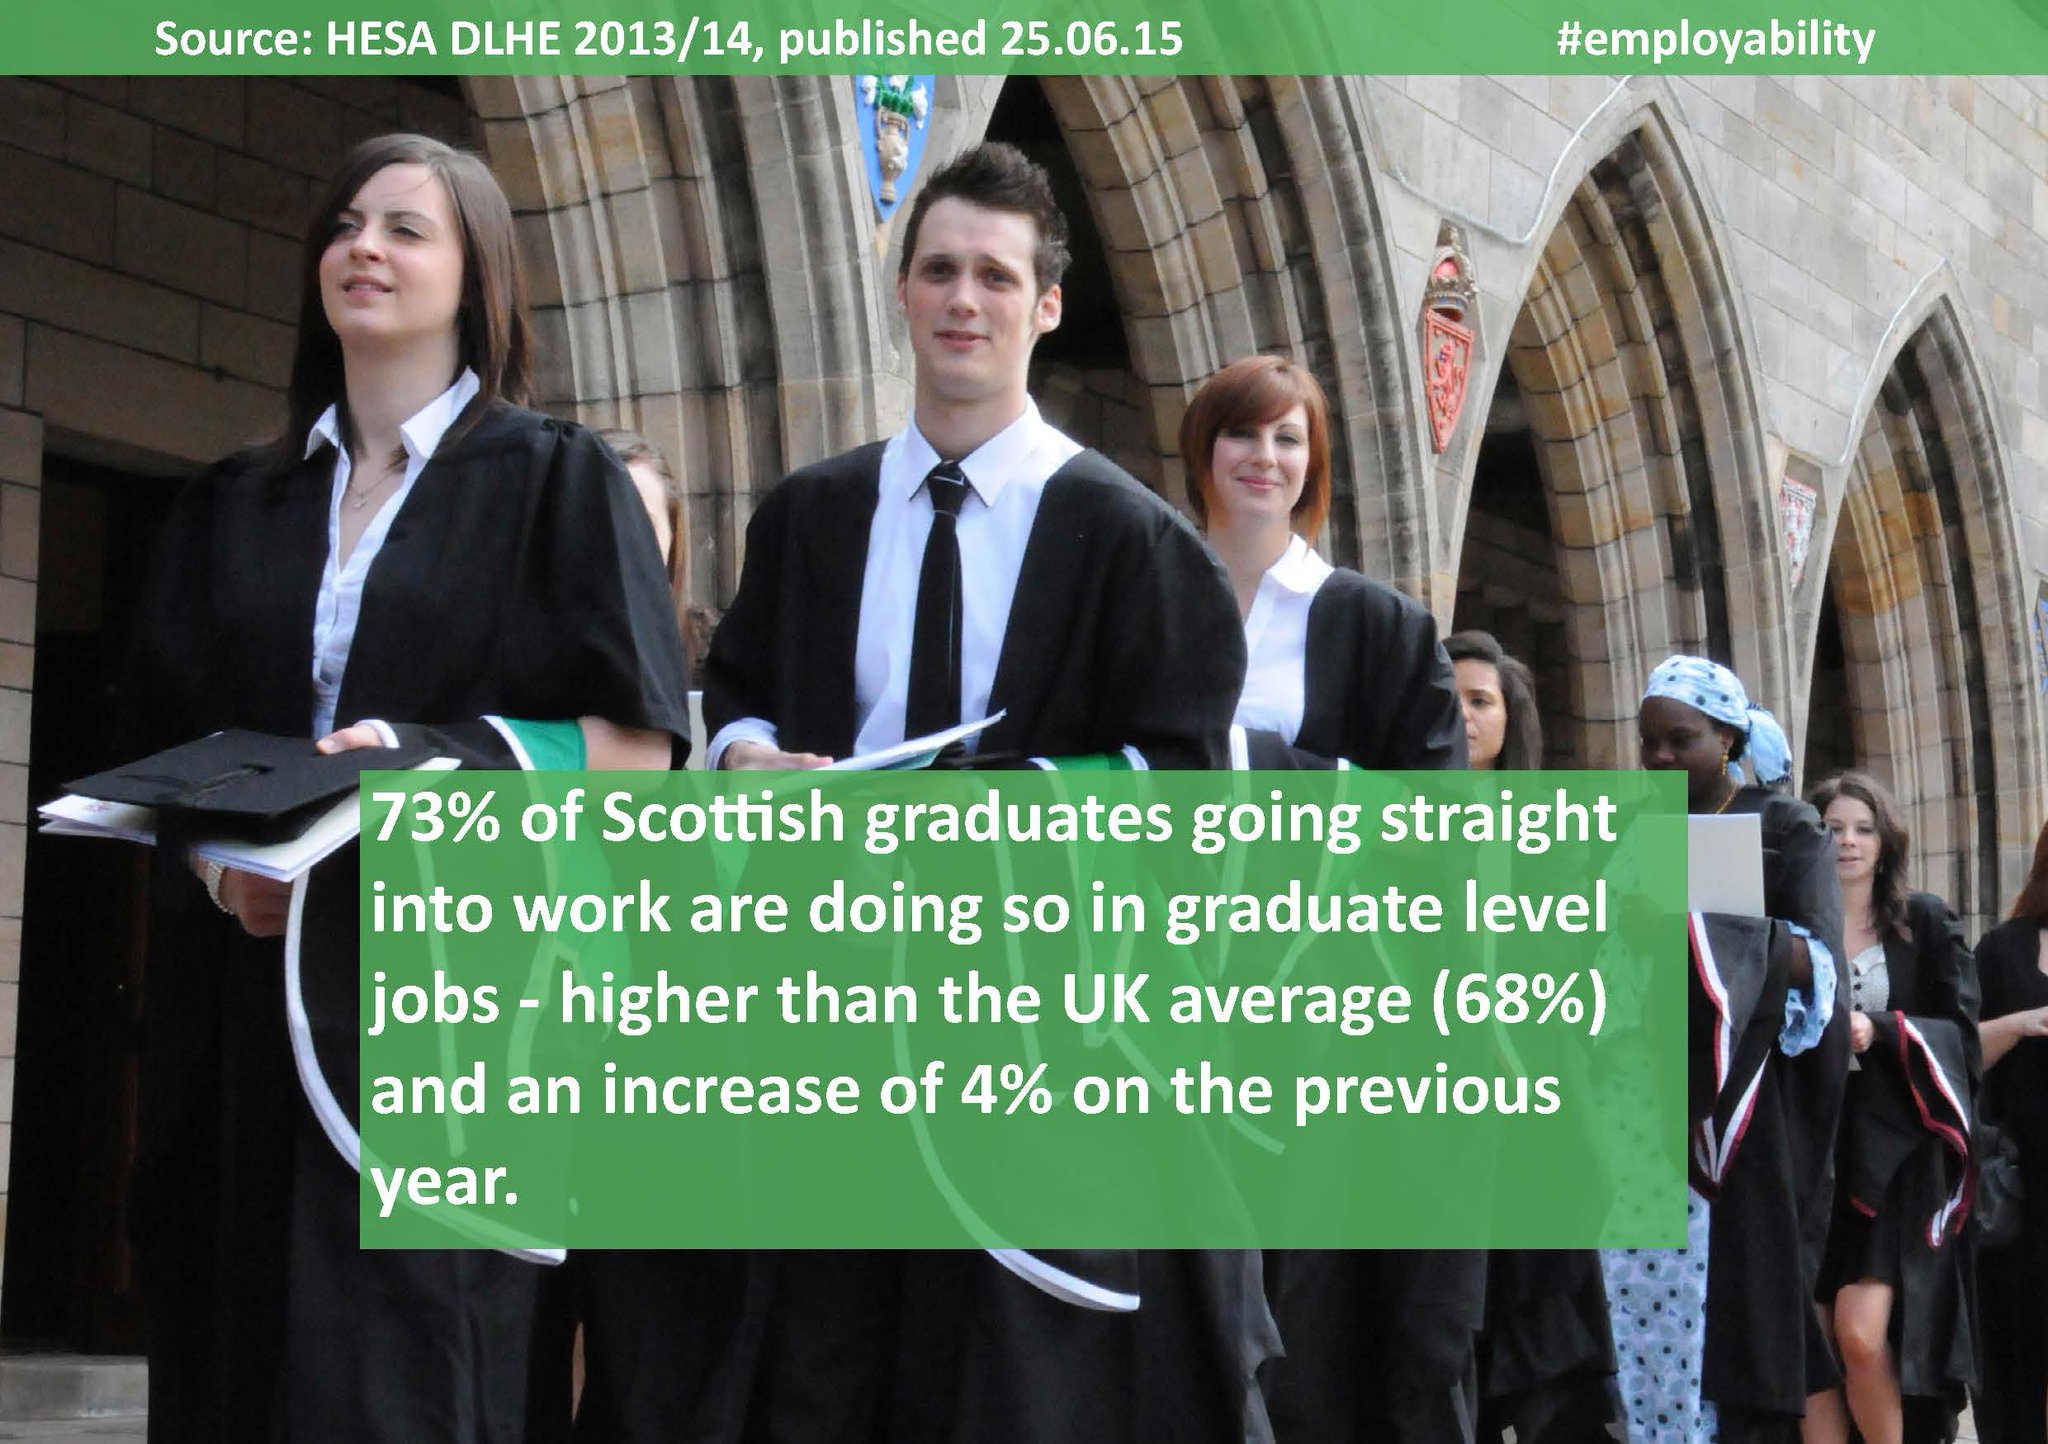
But more recent figures have pointed to an improving jobs market for graduates and the latest findings on those who left university last summer showed professional employment was up and salaries were higher. Two-thirds of graduates from full-time degrees were in posts classified as “professional employment”, according to the Higher Education Statistics Agency (Hesa).

UCAS figures suggest increased cost is a less strong limit on participation than capping

The latest UCAS daily clearing bulletin reveals a pattern of particularly large growth in England this year from students from Northern Ireland, Scotland and the EU, even though these students face much larger costs studying in England than in their home jurisdictions (see footnote).  While English students in England are 3% higher than at this point last year, Scots are 10% higher, Northern Irish students 11% higher and EU students 14% up.

In other words, lifting the cap in England seems to be having more of an impact on students from outside England than within it,  even at the expense of those students bearing greater costs.

The likeliest explanation for this is that in all three cases, domestic provision remains more tightly capped than in England.  The Scottish system is growing but since 2009 has not kept pace with rising demand (as acceptance rate figures from UCAS show: figure 11 here).  The same is true of Northern Ireland – indeed, with the figures currently showing a fall of 8% for home students in Northern Ireland the system there may even be contracting, in line with warnings from university leaders last year.  In the EU it’s a mixed picture, but plenty of EU nations have more tightly controlled entry to university and serve a smaller proportion of the population.

A smaller version of the same trend is also visible in the Welsh figures, with the growth in Welsh students higher in uncapped England than in capped Wales (although the increase in Welsh students in England is still only 3%).

For Welsh students,  study costs the same either side of the border.   So – counter-intuitively –  the fastest growing groups of students in England are all the ones  facing the highest cross-border costs by going to  study there.

At the same time, lifting the cap has not yet caused a large rise in students from England.  That does not suggest significant unmet demand for HE in England amongst those qualified to get a place.  Falling numbers of 18 year olds and part-time students being put off more by rising costs will both be relevant here.  But fee levels may also be kicking in as a constraint on full-time growth: it is impossible to know.

Notably, the number of EU students has fallen in Scotland and Northern Ireland (-6% and -20%), but risen substantially  in England and also Wales (+14% and +18%, compared to the same point last year).  EU students benefit from free tuition in Scotland and cheaper fee costs in Wales and Northern Ireland. At first sight, for this group availability of places rather than cost seems to be more clearly the issue: but EU numbers have been particularly volatile over the clearing period in the past.

It’s early days, but there’s definitely something worth watching in this year’s UK’s cross-border flows for those interested in the relative influence of cost and the availability of places on levels of participation in HE.

UCAS placed students in English institutions 5 days after A-level day 2015

Change For comparison
Domicile 2014 2015 Nos % Change in students studying in-country
E 319,760 328,330 8,570 3%
NI 3,260 3,620 360 11% -8%
S 1,400 1,540 140 10% 3%
W 7,660 7,920 260 3% 1%
EU 17,860 20,430 2,570 14% n/a
Total 351954 363855 11,901 3%

Source:  UCAS

 Footnote

Border-crossing Scots lose free tuition, although they may also save a year of living costs, due to shorter degree programmes, and at low incomes may pick up institutional grants or fee waivers. Northern Irish students have their fees capped below £4,000 if they stay at home, but pay up to £9,000 elsewhere in the UK. Systems elsewhere in the EU all have lower fees than in England, although some EU students may be banking on never having to repay the fee loan issued by the UK government and, as in Scotland, courses in England will tend to shorter than at home.


Rent rises for students highest in Scotland?

The Guardian has just published a couple of pieces highlighting that accommodation costs are rising faster for students tyhan for the general population.  There’ s a news piece here and an article by Shelly Asquith, vice-president of welfare at the NUS, here.  The emphasis is on how much of the loan is taken up by paying rent for many students.

The second of these pieces states that “Rents in the capital have doubled in the last 10 years, and in Scotland they are rising faster than anywhere else.” I haven’t yet been able to find the data on which this claim is made.

Both pieces are a useful reminder that student funding is about more than fees (or indeed grants).


HE access across the UK for the most disadvantaged: early signs from UCAS

UCAS has published its first set of figures relating to access to HE by background – see here.  These figures cover 18 year old applicants placed by UCAS so far, grouped using  the POLAR3 classification – more on that here.

These figures still have scope to change, particularly given the uncertainties around the effect of lifting the cap on numbers in England.  Anything at this stage is therefore no more than an indication of things to watch. With that caveat, the figures for today show that, compared to the same point last year:

  • progress in relation to POLAR3 Quintile 1 (the 20% most disadvantaged) seems to have stalled in Scotland;
  • the figures have slipped back in Wales;
  • there has been some improvement in England so far: the decision to abolish grants there from next year for new entrants may be having some effect,  creating an incentive to avoid delaying entry for those from poorer backgrounds;
  • the largest progress has been in Northern Ireland, although this comes on the back of a dip in the figures last year – quite a lot of this improvement is simply making up for that.

The tables below are taken from UCAS  and cover: the absolute number of 18 year olds from POLAR3 Q1 who have been placed so far; the entry rate for that group, which takes into account year-on-year changes in total number in the age group; and the difference in the entry rate of the most advantaged and least advantaged 20% (for example, in Scotland this year, those in Quintile 5 – the most advantaged – have an entry rate which is 363% of (or 3.63 times higher than) those in the most disadvantaged 20%).  The lower this last figure, the smaller the gap in entry rates between young people from different backgrounds: if access initiatives are working, year on year this number should fall.


2014 2015 Change
Q1 Nos Eng

17660

18440

4%
NI

360

410

14%
Scotland

570

550

-4%
Wales

1280

1230

-4%
Q1 Entry rate Eng

14.6%

15.1%

3%
NI

11.1%

12.4%

12%
Scotland

9.5%

9.5%

0%
Wales

14.0%

13.6%

-3%
Q5:Q1 Eng

255

249

-2%
NI

343

304

-11%
Scotland

361

363

1%
Wales

261

278

7%


The picture over the longer term remains of general growth in the entry rate for the most disadvantaged young people in every part of the UK.  The question these figures beg is whether, stripped of the effects of catching up with a less good previous year (NI) or possible short term incentives (England), the sort of growth seen over recent years will continue, or whether the signals are from Scotland and Wales that it might be starting to flatten.  It will be a year or two more before that will be clear and a few weeks yet before even this year’s picture comes into focus.


Clearing in Scotland for Scots – a running tally

This post is simply to capture how the position changes on UCAS website in relation to places in Scotland for Scottish students as clearing proceeds, because this information has to be picked up in real time, as UCAS updates its site.  It will be updated periodically over the next three weeks.

Important note: the results for institutions on the UCAS website are not always the same as on institutional websites (see below for an example).

Update note Thursday 6 August: Little change since Tuesday, except in one striking case.  Heriot Watt,  which accounted for a significant number of the courses listed on the first day, has disappeared completely. The university’s own website is still listing many courses, but only for students “whose home address is within the Scottish Index of Multiple Deprivation (SIMD) 40%”.   This reveals a largely unnoticed development in Scotland, where the focus has tended to be on differential clearing for Scots/EU and the rest (including rUK).  The ring-fencing of access places is now creating a further split in the Scottish group: widening access places and the remainder.  As some of the “access” places are not being listed by UCAS (but some – such as those at Dundee – are), the UCAS site is no longer a consistent guide to available space either for those in the access group or those who aren’t. A protocol for how places ring-fenced for access are presented on the UCAS clearing site – either they are all there or none are – would surely be more helpful for students. It seems an odd thing at first sight that this is not the case.

With the Heriot Watt access places removed, UHI and UWS now account for just under three-quarters of all courses listed by UCAS. Elsewhere, there’s some ebb and flow at the margins: the one course listed at GSA has gone;  a few at UWS have also been removed; the course first listed at Napier is gone, but 4 nursing courses have been added; Digitial Media has been added at Stirling; and there’s one further course listed against UHI (though that could equally be a counting error by this author).

Update 11 August: No change to the number of courses listed for several institutions, but a sharp drop in the number still listed for QMU, from 10 to 2.  Little change recorded for UHI.  UWS still has the largest number listed (77) but this is lower than the 94 shown last Thursday.  Heriot Watt’s own website now shows no vacancies for any Scottish students, even those from disadvantaged backgrounds (see note for 6 August).  As ever, changes to the UCAS site will reflect how quickly institutions update their information, as well as what vacancies have actually been filled.

Degree courses lasting least 3 years listed as available in clearing for Scottish students

04-Aug 06-Aug 11-Aug
Aberdeen 0 0 0
Abertay 14 14 11
Dundee 3 3 3
Edinburgh 0 0 0
Edinburgh Napier 1 4 4
Glasgow 5 5 5
Glasgow Caledonian 0 0 0
Glasgow School of Art 1 0 0
Heriot Watt 75 0 0
Queen Margaret 10 10 2
Robert Gordon 3 3 2
Royal Conservatoire 0 0 0
Scotland’s Rural College 16 16 16
St Andrews 0 0 0
Stirling 3 4 2
Strathclyde 0 0 0
UHI 56 57 55
UWS 96 92 77
Total 283 208 177
UWS/UHI/HW 227 149 132
80% 72% 75%


80% of clearing places for Scots in 3 institutions

The limited number of places in clearing for Scots who wish to study in Scotland, and benefit from free tuition, has become an annual news item. The distribution of these has received less attention.

The Scottish Government needs to control tightly the cost of the system and therefore the number of students recruited. Media reporting so far this year has been quite careful (see here and here for example) to explain that (a) this is the reason that far fewer choices are available to Scots (and EU students) in clearing than for those from other parts of the UK, who bring their funding with them over the border, and (b) that students from the rest of the UK are therefore not getting places at the expense of Scots.  On-line discussion suggests that this point is still not always well-understood, but becoming better appreciated.

A look at clearing today brings out a less-discussed aspect of the system.  The table below shows the number of courses (not places, NB) each Scottish institution was advertising first thing today for Scottish students.  The figures are for undergraduate degree courses lasting at least 3 years (so they exclude the LLB, a 2-year graduate entry fast track law degree, for example).

It stands out from this that 80% of available courses are at just 3 institutions (Heriot-Watt, UHI and UWS).

Total
Aberdeen 0
Abertay 14
Dundee 3
Edinburgh 0
Edinburgh Napier 1
Glasgow 5
Glasgow Caledonian 0
Glasgow School of Art 1
Heriot Watt 75
Queen Margaret 10
Robert Gordon 3
Royal Conservatoire 0
Scotland’s Rural College 16
St Andrews 0
Stirling 3
Strathclyde 0
UHI 56
UWS 96
283

Source:   UCAS vacancy search tool, Tuesday 4 August

Both of Dundee’s and two of Napier’s are on courses based in partner FE colleges, and two of Glasgow’s are at its Dumfries campus. Heriot Watt’s courses unsurprisingly lean strongly towards relatively specialist science and technology subjects.

In other words, Scottish students who don’t make their initial offer and who want to benefit from free tuition will have a very limited range of choices. What space there is in the Scottish system  is very concentrated in a handful places, and there are strong overlaps with the pattern last year (see here) when UHI, UWS and SRUC were the three with plenty of availability a week after highers, although Heriot Watt was by then full.

The distribution of courses with vacancies can be summarised like this:

No of courses in clearing No of institutions
0 6
<10 6
10 to 20 3
20 to 50 0
>50 3


That brings out that not only are numbers capped, but that the way the system is funded, through providing each institution with a block of grant which is determined centrally in advance of decisions on recruitment, creates a system driven by far more by the historic location of provision rather than student choice.

As the availability of places tightens relative to demand (see here), that deserves more attention.  It is not inevitable that a fully funded system is also one which largely requires students either to follow historic recruitment patterns or else forfeit their access to free tuition.  There’s scope for ensuring the same institutions do not dominate clearing year after year,  without applying the full-blown  “weakest to the wall” approach which is coming to characterise the now uncapped, largely student demand-led system in England.

It can’t be said too much – the acceptance rate in Scotland is at a historically low level: supply is not keeping up with rising demand. That’s not necessarily an indefensible position: perhaps more of the demand is simply not worth meeting, compared to a decade ago – there would be ways of examining that.  However, a system which gave more priority to meeting student demand would still at minimum be looking at why some institutions are persistently bringing large numbers of vacancies to clearing when most others are full or almost full before it starts.  There may be specific policy reasons – say, that UHI is still relatively new  and is being deliberately built up to create demand in the highlands and islands.  But in such a tightly capped system, if any resources end up locked long-term into parts of the system for which demand is low that will be increasingly problematic for students and there ought at least to be a debate about why that is happening and whether it should continue.


Footnote

Scots who cannot get a place in Scotland will be in no worse position than students from England or  Northern Ireland once the institutions south of the border come into clearing next week and can still take advantage of the uncapped system there.  As in the rest of the UK, they can get a non-means tested student loan to cover the upfront cost of the fees.

But Scots who had not previously considered going south will be looking at a decision to take on a much large cost of study at relatively short notice – their contemporaries elsewhere will at least have had longer to think about that.

Also, the persistent emphasis in Scotland on “ability to learn, not ability to pay” seems to have created a quite widespread misunderstanding here that going south means families have to find the full cost of the fee upfront and lack of awareness of the availability of fee loans from SAAS. That does a disservice to would-be students, discussed more here.


Why early data from clearing should be handled with care

The first set of UCAS acceptance figures for this year are due out on Tuesday (4 August), covering the position for Scottish students immediately following highers results.

These figures often attract quite a bit of political and media attention (see for example the 14 August 2015 press notice issued by the SG reporting the 4% increase in Scots accepted onto a course), but need to be taken with a pinch of salt.  As the table below shows, anything published this week, or next, is only the initial position of a fluid process.

This week’s figures will provide information on how many people this year compared to last in absolute terms have got onto one of the courses they initially applied for  –  from the perspective of applicants, it is generally a good thing if this number rises.  But we won’t know whether a higher or lower proportion of applicants did so than last year, or how many and what percentage of applicants have got a place somewhere.  These things for a little longer to emerge.

How the position can change

Last year the year-on-year increase in Scots accepted at the very start of clearing was 4.5% compared to 2.4% by the end of the application cycle for all those who had applied before 30 June and -3.7% for all Scottish applicants in total (but see footnote).

Factors affecting the initial UCAS figures

The figures show that last year more people got one of their initial choices and fewer ended up getting a place through clearing than in 2013.  The number getting the course they initially applied for will tend to be higher when a system is expanding, more places are available and offers may be lower – but it will also increase when exam results are improving.

In same way, when a system is contracting, the number getting their initially offered place might be expected to fall – but worsening exam results would also mean fewer students meet their initial offers but more places are then filled through clearing. In that case, the percentage change from the previous year could rise  as clearing proceeded. So, for example, if concerns about the difficulty of this year’s SQA Higher maths exam were to translate into lower grades, there might be some visible impact on the numbers meeting their initial offer criteria (though the SQA has said that its marking system should adjust for a more-difficult-than-usual exam).

In other words, if the figures on Tuesday show a relatively low percentage increase, or even a fall, it will be surprising but we’ll need to wait a couple of weeks before any real conclusions can be drawn.

Comparability with 2014

There’s also an issue of comparability with 2014.  This year, a large group of teaching training courses not previously using UCAS has come into the system, which is increasing the figures: explained here.  When it published applicant figures earlier this year, UCAS therefore produced two sets for Scotland – the raw data and figures adjusted to remove the new group of students, for like-for-like comparability. Before adjustment, applicants appear to have risen by 10%; with the adjustment, the figure is 2%.

If the clearing figures are not similarly produced in two forms, they will not be much use – any press release or article drawing on the unadjusted data will be extremely misleading.

The underlying big story: responsiveness to rising demand

There’s been coverage lately of signs that the number of Scottish students accepted onto a course (particularly in Scotland, covered by free tuition) is not keeping pace with rising demand, something already discussed elsewhere on this site. Contributing factors identified have been growing numbers of EU students (who compete with Scots for fully-funded places) and declining willingness on the part of Scots to go to the more expensive south (for which the SG offers no portable fee grant). Also, while the total number of funded places is still growing, that growth remains quite tightly capped, particularly relative to England.  Last year, acceptances rose at a similar pace for students from Wales (2.7%), fell for the Northern Irish (0.7%) but rose by 4% for those from England  (table 4 here, p4 of report, p23 of pdf).

This week’s figures won’t tell us anything reliable about the year on year change.  However,  by the end of August last year the numbers had pretty much settled down, so that’s the first time it’ll be worth taking a proper look,  to understand how far the numbers are growing.  By December,  the final position will be clear (presuming the reporting problem with late applicants discussed in the footnote has been fixed).

It would be remarkable if the number of Scottish students getting a place through UCAS does not increase further, as the number of funded places is still increasing.  For the number of Scots to fall would take a very sharp increase in EU students being awarded places in Scotland or for universities to reduce the numbers they take in over and above the official number of funded places.  A bit of unfunded growth may have been something of a safety valve in Scotland in recent years – it’s hard to tell from the statistics – and at some point institutions may find their capacity for that becomes too strained.  However, it’s not likely that either of these two things will kick in with enough force to undermine the general upward trend of recent years.

Potentially more salient will be to compare how the growth in acceptances compares with the growth in applications.   The “acceptance rate” for Scots has fallen markedly over the past decade, including in the last year (as in Northern Ireland, but in contrast to Wales and England)  – see Figure 11 here (p11 of report, p30 of the pdf).  That means Scotland is doing better at encouraging more young people to aspire to university than it is at making sure there’s actually a place for them to go to.

Like-for-like applications were 2% higher this year by the end of June.  The government will probably be hoping to see the increase in acceptances by the end of this month at least matching that figure and – if the trend of falling acceptance rates over the past decade is to start to be reversed – exceeding it.

 Number of Scottish-domiciled students accepted over the period of clearing: 2013/2014 change

UCAS issued daily bulletins for the 2 weeks following A-level results.

Reporting point 2013 2014 Change (%)
Highers day 23430 24480 4.5
A level day 26910 27910 3.7
plus 1 27150 28080 3.4
plus 4 27480 28340 3.1
plus 5 27640 28500 3.1
plus 6 27800 28660 3.1
plus 7 27940 28810 3.1
plus 8 28090 28910 2.9
plus 11 28460 29110 2.3
plus 12 28550 29190 2.2
plus 13 28640 29340 2.4
plus 14 28740 29470 2.5
End of cycle (apps up to 30 June) 29000 29710 2.4
End of cycle (inc apps after 30 June) 31495 30315 -3.7


Footnote

Frustratingly, the end of cycle figure for 2014 Scottish acceptances  contains a large uncertainty. UCAS reports that:

In 2014 there have been fewer very late acceptances than in previous cycles recorded in the UCAS data for some Scottish providers. These changes may mean that the number of applicants and acceptances to Scottish UCAS providers in 2014 recorded through UCAS could be understated by up 2,000 compared to how applicants and acceptances have been reported in recent cycles. This means that comparing 2014 applicants and acceptances for Scottish providers (or those from Scotland) to other cycles will not give an accurate measure of change. (see note on p5 of pdf here).

UCAS hasn’t provided much detail beyond that.  So it may well be that the -3.7% fall recorded in total acceptances can simply be ignored.  Or it may be that there really were fewer places available to be filled by very late applicants last year – but perhaps not a whole 2,000 fewer.  It is completely impossible to tell. It’s not clear whether the possible change in reporting practice is a one-off or likely to affect this year’s figures also.

A comparability problem therefore lies ahead for this year, too: as things stand,  if the final figure rises again, we won’t be able to tell easily how far it is real and how far a further reporting effect (certainly, come December it will be important not to  look at the 2014 to 2015 change in isolation).

In essence, we can no longer reliably compare year-on-year changes on total applicants and acceptances in Scotland. It’s hard to imagine that the government, opposition parties, institutions, think tanks and the media collectively in England would have stood for a similar large uncertainty being left hanging over the figures there, but we seem to be stuck with it here.

Even if the like-for-like number can’t be pinned down better, it would be helpful if  the UCAS end of cycle report this December could say more about what lay behind the fall (which institutions were affected, for example? did these all change their reporting practice in 2014 and if so why?) and explain in more detail why it believes a recording change may explain all or most of the drop.  It could also helpfully explain how far this year’s figures may be similarly affected.

Meantime, the only reliable comparisons which can be made are for those applicants who applied by the end of June, whose figures are unaffected, which gives most but not all of the picture.


Grants make for an early Holyrood/Westminster problem for the SNP

Student grants look set to provide one the first clear illustrations of the difficulties of being in opposition in one place and in government in another.

An early day motion put down by Jeremy Corbyn on 13 July stating:

That this House notes the increase in the participation of working class students in higher education since maintenance grants were reintroduced; condemns the proposal to cut grants as a direct attack on the poorest people accessing higher education in England; further notes that the transition from a subsidy to a loan will push the poorest into the highest level of debt; and urges the Government to halt these plans in favour of a system whereby students can access more generous grants in order to cover the rising costs of living.

has been signed by three SNP MPs (Chris Law, Christopher Stevens and Michelle Thomson – though not Mhairi Black, famously the most recent graduate at Westminster). But there’s a catch.

In 2013, student grants in Scotland were cut very significantly – some 40% or £35m was removed from spending on means-tested student grant. The worst affected students lost over more than £1,500, or more than half their grant – some mid-course. As now proposed in England, the lost grant was replaced with loan.  As  result, Scotland became the only part of the UK where the less your family earned, the more you were expected to borrow.  England will go the same way from next year, as the motion notes.  The changes in England are at least being phased in for new starts only.

A motion put down in the Scottish Parliament in June 2013 seeking reversal of the grant cuts in Scotland received very unsympathetic treatment from government backbenchers. The motion, S4M-06843, moved by Hugh Henry (Lab) stated:

That the Parliament notes the introduction of the minimum income guarantee for students; notes that grants for lower-income students are being cut; believes that lower-income students are being financially disadvantaged in Scotland compared to elsewhere in the UK; does not accept that lower-income students should be disadvantaged in order to provide support for those from better-off households, and believes that the cuts to grants for lower-income students should be reversed in order to address inequality in access to higher education in Scotland.

No government backbencher signed it, those who spoke in the debate were uniformly critical of the opposition for proposing it and all votes from the government side were for a replacement which removed all criticism (indeed, mention) of the cut.

It may be significant that the SNP members signing the Westminster motion all did so in the first few days after it was put down. It is possible that the tension may have been spotted, but not quite in time to stop a few people from going with their instincts.

The grant cuts at Westminster deserve to be challenged. It’s a pity that a similar challenge in Scotland received such a different response from the SNP in government, but it would be good to think that these three MPs might now use their position in that party to challenge from within decisions made on grants in Scotland which the evidence here suggests they must believe to be wrong.


Paging Stewart Hosie MP: grants are not the best advertisement for devolution

Stewart Hosie MP, the party’s deputy leader is reported to have said immediately after the budget (emphasis added):

The Tories’ cuts in the living standards of young people are particularly severe, including scrapping student grants. The SNP Government will continue to deliver grants for the poorest students in Scotland, demonstrating the benefits of having these powers in the Scottish Parliament, rather than in Tory hands at Westminster.

As with the Early Day motion discussed in this post, there’s a difficulty with this line, because student grants have been  severely cut in Scotland in recent years. Total spending on grants is now about three times higher in England than in Scotland, proportionate to size. The phasing in of the changes in England means that by 2017-18 total grant spending in England will still only have fallen to something around current Scottish levels – it won’t fall below those until 2018.

Indeed, looking at the picture since 2001, when Scotland was first able to implement a different policy on grants, and 2018-19, by when the English changes have taken almost full effect, spending on grants in Scotland will often have been well below the (rough) figure of 10% of spending in England which would suggest broad comparability. On current policy, spending on grants will have been proportionately higher – since 2013-14 much higher –  in England than Scotland in 10 years out of  these 18.

In other words, whatever separate case may be made in relation to fees, student grant is not the best advertisement for devolution’s capacity to do more for students, particularly in the period since 2007.

Background: detailed calculations

Scotland spent relatively more on grants between 2001-02 and 2007-08 (at points double the amount relative to size), but subsequently fell behind, as grant rates were substantially increased in England, but frozen and then cut in Scotland. For the recent years for which figures are available (all figures £m):

2007-08 2008-09 2009-10 2010-11 2011-12 2012-13 2013-14
actual actual actual actual actual actual actual
Scotland 72.4 70.7 75.3 93.5 90.7 89.4 53.0
England 629.6 998.6 1207.8 1259.1 1,334.60 1,433.30 1,590
Scot as % Eng 12% 7% 6% 7% 7% 6% 3%

Figures from SLC and SAAS.

… and looking ahead, on current policy spending will remain lower pro rata for some time yet.  The figures here assume no major change in spending 2014-15 and 2015-16 (which saw no major policy changes on grant in either country) and take into account a small grant rise planned in Scotland from 2015-16 and the phasing out of grants for new starts only in England from 2016-17.

2014-15 2015-16 2016-17 2017-18 2018-19
est est est est est
Scotland 53.0 60.0 60.0 60.0 60.0
England 1,590 1,590 1113 715.5 238.5
Scot as % Eng 3% 4% 5% 8% 25%


Student living cost support in England and Scotland: policies coming closer, scrutiny worlds apart

With the abolition of student grants announced earlier this month, in 2016 England will join Scotland in having a student funding system which expects the poorest students to borrow the most.  Wales and Northern Ireland are still, for now at least, holding out for the use of  student grant at a sufficient level to ensure  poorer students are not expected to borrow more than their better off  peers (and in the case of Wales, substantially less).

England is also coming into line with Scotland with the planned freezing of the loan threshold.  This blog has repeatedly made the point that the lower loan repayment threshold in Scotland has a particualrly large effect on lower earning graduates.   The new English threshold is in effect the current one for Scotland.  Using IFS figures, Andrew McGettigan points out that moving to this new, lower threshold “increases the costs of undergraduate study by a quarter or more” for those in the bottom 70% of earners, compared to the original plans for a higher threshold in England – while the abolition of grants in fact has very little impact on that group, for the reason discussed below.

Two large differences remain between England and Scotland.

The first, of course, is that total debt will be even higher south of the border. That has the counter-intuitive effect that the latest grant cuts will have no real impact on the majority of poorer students: the IFS estimates that up to two-thirds of those at low incomes will see no difference in what they pay back, because they were already unlikely to pay their whole debt before it was written off (after 30 years).  Those most affected will be the graduates from poorer homes who go on to earn relatively well: it’s an almost perfectly designed  de facto social mobility tax. The Scottish grant cuts by contrast added debt to a lower pre-existing level borrowing (around half the English level) so they are more likely to translate into real extra payments for poorer students,  across all but the lowest earners. In both cases, the policy change has increased costs at low incomes on paper: in Scotland,  the total debt resulting is still lower, but the changes will have a much larger impact in practice.  It’s a paradoxical effect.

The second difference is in the wildly different levels of scrutiny – and, before that, government transparency – in each case.  The comparison with reaction to the changes announced in England reinforces how poorly the government policy Scotland in this area has been scrutinised and held to account, and how much freer the government in Scotland has been to avoid involving parliament or even stating outright what the effect of its decisions will be. The absence of independent voices  – such as think tanks and interest groups – willing to speak up for those affected by grant cuts in Scotland  is also stark, as is the lack of media coverage of domestic policy within Scotland. BBC viewers in Scotland, for example, have been informed about grant cuts which haven’t yet happened in England and won’t affect Scottish students, but not of grant cuts which have affected every student in receipt of a grant in Scotland since 2013.

The differences, and similarities, in the changes in the two countries are summarised in the table below.

[Update: it’s been pointed out that the analysis below ignores the continuing existence of grants provided direct to students by institutions in England, which now account for a substantial amount of such payments.  It’s a good point. There’s not yet been any suggestion that these locally-managed payments will cease and if they do continue, then spending on all types of grant in England could in fact remain close to Scottish levels, even after the national scheme for English students is would down.  However,  these grants are not consistently available, making them hard to include in any comparison, and OFFA has questioned their effectiveness, so their long term future may be uncertain.]

Scotland England
Timing From August 2013 From August 2016
Students affected Changes were applied to all students, including those already in system Changes will affect new starts only, other than changes to loan repayment threshold (see below).
Grant 


Means-tested grants substantially reduced, with cuts of up to 100%, depending on students’ income and whether young or mature. Overall reduction of around 40%. Means-tested grants will be entirely abolished.
Maximum reduced from £2,640 to £1,750.For those below max, gradually tapered system replaced with step-change reductions, with students getting £1,000 or £500, depending on income.From 2015-16, entitlement in middle band rises to £1,125 and max entitlement rises to £1,875. Maximum of £3,387 in 2015-16. For those below max, system is currently tapered, with entitlements falling gradually as income rises.
Spending on means-tested grants fell by 40% following changes.Spending fell from £89m in 2012-13 to £53m in 2013-14. Spending likely to fall by something like 30%/55%/85%/95% over the 4 year period from 2016-17. Spending should be de minimis by 2020.At £1.6bn, spending on grants in England is currently around three times higher than in Scotland, pro rata size. It will be at a similar level in both countries by 2017-18, before falling further in England.
Thresholds Threshold for max support was reduced from £19,300 to £16,999 (rising back to £18,999 from August 2015).Upper threshold was left unchanged at £33,999. Threshold for maximum support will be maintained in 2016-17 at £25,000.Upper threshold for grant currently around £42,000: will no longer be relevant.  Not yet clear how loan entitlements will reduce at  incomes above £25,000.
Loan (entitlements) Loan replaced lost grant Loan will replace lost grant
Further loan was made available to increase total living cost support in real terms.Minimum loan increased from just under £1,000 to £4,500 (now £4,750). Further loan will be made available to increase total living cost support in real terms.Minimum loan previously £3,610: no suggestion as yet that this will rise.
Total value of support (grant plus loan) Maximum support (away from home) increased by 13.6% .In 2015-16, maximum, whether living at home or away and regardless of place of study, will be £7,625.Falls to £6,875 at £19,000; £6,250 at £24,000; £4,750 at £34,000.Figures for 2016-17 not yet available. Maximum support (away from home) increased by  13.1%.In 2016-17,  maximum if living away will be £8,200. Max will be £10,702 for those in London.  Living at home max will be £6,904.Applies at incomes up to £25,000. Not yet clear what figures will apply above that.
Debt distribution Regressive: highest debt now expected at lowest incomes. Regressive: highest debt will now be expected at lowest incomes.
Total debt 4-year degree debt at lowest incomes of £28,000 (mature) or £24,000 (young student), including interest. Expected 3-year degree debt of around £53,000 at lowest incomes (young and mature).
Loan (repayment rules) No change was made to rules for the repayment threshold in 2013.The threshold is £17,335 in 2015-16, and will continue to rise in line with earnings.It should reach the cash value of the current threshold used in England in around five or six years. Loan repayment threshold, currently £21,000, to be frozen for five years, rather than rising in line with average earnings as originally promised.
Students affected All. UK govt consulting on whether to apply threshold freeze only to new entrants or to all those who have taken out a loan since 2012: seems likely to be applied to all.
Likelihood borrowing will actually be repaid Relatively high, due to smaller overall total and relatively low repayment threshold. Relatively low, largely due to scale of sums involved, although freezing the repayment threshold will increase how much is repaid (by around £6,000). Freeze means that by around 2021/22, repayment threshold will no longer be lower in Scotland.
Form of announcement Press release on changes to student support from 2013-14 issued 22 August 2012 making no reference to grant cuts or reduction in threshold for max support, and concentrating on increase in total combined max value of loan/grant support. No announcement of student support changes to the Scottish Parliament. SG has yet to officially acknowledge grants were reduced in 2013 (only Ministerial comment to parliament has been to suggest there had been no cuts to grants, though this was formally corrected later). Changes to loans and grants announced to parliament in budget on 8 July, followed by a detailed ministerial written statement on 9 July.
Reaction
Parliament/opposition parties Opposition debate June 2013 and various opposition PQs: criticism from Conservatives, LibDems and Labour (not Greens). No parliamentary approval required for changes.  Early day motion opposing grant cuts, with signatories so far from Labour, Lib Dems, SDLP, DUP and SNP.  Greens have started a petition on 38 Degrees. Regulations will need to be approved by parliament later in year.
NUS Very positive, addressing only the general increase in living cost support, telling members “Take some time today to celebrate and reflect on what a huge win this is, one that will fundamentally change the lives of so many of our members. … Today is a great day for the student movement in Scotland, so take some time to savour it.” Very critical.
BBC Has never reported grant cuts in Scotland; repeated terms of SG news release in August 2012. Did report grant increase of £125 announced in May 2015. Various pieces on planned grants cuts and loan repayment increase.
Press No reporting of grant cuts until  opposition identified the plans in October 2012 (picked up  by Scotsman only). More coverage since summer 2013, prompted by work by this author. Extensive coverage of grant cuts immediately after announcement and of trails of announcement in preceding month.
Independent think tanks/commissions No analysis or reaction to changes in Scotland in almost three years since they came to light. Briefing note from IFS on impact of changes in England published on 21 July 2015.Comment on effect of grant cuts in report from Independent Commission on Fees on 30 July 2015.
Other Report commissioned from this author (a freelance researcher) as part of ESRC-funded project in early 2014, after self-publishing. Mainly so far on the Critical Education site, run by freelance research Dr Andrew McGettigan.

Can the Access Commission convince the Scottish Government to stop playing Jekyll and Hyde on student loans?

Only two-thirds of the poorest young students in Scotland are benefiting from the Scottish Government’s flagship policy of a “minimum income guarantee”. Most of the rest are trying to get by on just £1,750 a year in grant.

My evidence to the Commission on Widening Access (in full here) highlights this as a critical issue for the Commission to consider.  In particular, the Commission is asked to take a view on whether the the Scottish Government has acted responsibly in shifting support for poorer students ever more heavily into the form of loan, while still trying to benefit politically from a negative rhetoric about the impact of borrowing on poorer students.

In 2013, Scotland moved to a system of funding students’ upfront living costs much more heavily reliant on loan than before, cutting grants and using additional loan to generate an real-terms increase in total support. It did so even though in a report to the Scottish Parliament in April of that year the Scottish Government argued that (emphasis added):

… evidence sources suggest that the fear of debt and cost of study can potentially dissuade prospective students to going to university. People from disadvantaged family backgrounds are especially vulnerable in this respect.

BIS research notes that most young people see debt as a normal part of life, but that those with the most negative attitudes to debt are among those least likely to apply to HE. It suggests that students from low income households see the costs of HE as a debt rather than an investment. Those from less privileged backgrounds were more likely to be concerned about debt, and those most averse to debt were among the less willing to participate in HE …

So it should not be a great surprise to learn that if low income students are offered support which looks like this (2014-15 figures):

Household income Bursary Loan Total % as loan Implied 4 yr debt
£0 to £16,999 (young) £1,750 £5,750 £7,500 77% £23,000
£0 to £16,999 (mature) £750 £6,750 £7,500 90% £27,000

.. against a government rhetoric about the unattractiveness of student loans which sounds like this ….

 As somebody who had a modest upbringing in a council scheme in Linlithgow, whose parents in an atmosphere of both free education and full grant, scrimped and saved to send four children to university, I know what a challenge and what would have happened with the imposition of large debt to people like myself. (see here)

I would not have had that opportunity [to go to university] if there had been a policy of tuition fees in place, because even if there had been a policy of paying them back later, the prospect of accumulating that scale of debt would have been enough, I think, to lead me not to go to university. (see here)

… many students entitled to a maximum bursary appear to find the level of borrowing needed to obtain the “minimum income guarantee” unattractive.

Here are the figures in detail, obtained not from any analysis published by the government, but from further questions (they are for 2013-14, the only year under the new rules for which there are figures):

Actual on full grant Actual on maximum living cost support % take up of maximum living cost support
YSB claimants 17,330 11,485 66%
ISB claimants 17,340 13,645 79%
Total 34,670 25,130 72%

We can also tell that most of those on a grant who didn’t borrow the maximum, borrowed nothing at all – there are very few “partial borrowers”:

YSB % of all YSB takers ISB % of allISB takers Total % all YSB/ISB takers
Taking no loan 8,090 25 2,620 15 10,710 21
Taking part of loan 1,775 5 300 2 2,075 4
Taking whole loan 23,065 70 14,480 83 37,545 75
     
Total 32930 100 17,400 100 50,330 100

The unavoidable conclusion from these figures is that many students at the lowest incomes did not just reject the full “minimum income guarantee”, they limited their entire state support to an amount of grant that would barely cover their commuting costs, even if they tried to save money by living at home (in a household where money is by definition already tight).

The Scottish Government urgently needs to review a policy that evidently isn’t working for many of those it most needs to help.  At the very minimum, it needs to stop making political capital by talking down student loans, while shovelling these towards poorer students in large amounts, as their only alternative to derisory levels of state support. At the moment, the “minimum income guarantee” is a policy which is failing many of those it is intended to help  and something – the heavy reliance on loan, or the surrounding negative rhetoric about student borrowing, or probably both – needs to change.

Critics of government policy on student funding in Scotland have had no success in getting a hearing over the past two years. The government’s dismissal of figures just last week showing Scottish students making more contact with payday lenders than those from elsewhere in the UK, revealed more of the same Jekyll-and-Hyde attitude to loans – talking up its “minimum income” while invoking scary five-figure debt figures from south of the border.

Perhaps Ministers might listen to the Commission on Widening Access if it takes an interest in the situation described above.  Let’s hope it will.

Evidence to the Commission on Widening Access

My evidence to the Access Commission concentrates on the relationship between student funding and widening access.  It’s provided in full below, under the three headings the Commission has asked those responding to its call for evidence to use.

(More detailed evidence underpinning the points made is provided here: Annex to Access Commission evidence.)

The identification and removal of barriers to access and retention

The available evidence suggests that student funding plays a smaller part in determining participation in higher education by disadvantaged young people than is generally asserted in political, media and social discourse. Other factors, such as family attitudes, school attainment and subject choice and the extent of well-designed access work undertaken in schools, appear likely to have a much larger influence.

Elements of student funding which have been argued at various times to have an effect on participation are:


  • Tuition fees: International and internal UK comparisons provide no evidence for a link between fee levels and access, particularly once the immediate costs of fees are covered by access to a state-supported loan.


  • Total debt (whether for fees or living costs): Contrary to expectation, across the UK as debt has increased so has participation by young people from disadvantaged backgrounds. This does not rule out that some young students are deterred by debt and various studies emphasise the need to understand better which students are most debt averse. However, in general terms any deterrent effect is being outweighed by other factors. Participation by mature students, whose numbers are falling in all parts of the UK, seems to be more sensitive to debt: but even for this group, other factors also seem likely to be having an effect.


  • Grant rather than loan: There is some recent research evidence that substituting grant for loan in living cost support may slightly increase participation by low-income students, which would be consistent with some in this group being relatively debt-averse.


  • Total support for living costs: Again, there is some evidence that increasing living cost support in total, whether using grant or loan, slightly increases participation, which would be consistent with students from low incomes being otherwise deterred by an inability to meet upfront costs such as rent, food etc .


Issues for Scotland

(i) Largely loan-based living cost support

In Scotland, the system for supporting living costs is heavily dependent on the use of loans: at low incomes, students must borrow between £6,750 and £5,750 a year in order to obtain their full support, implying a total debt of between £23,000 and £27,000 over four years (more for those on 2+3 models). This model is not working for many of those for whom the most help is intended. Only two-thirds of the poorest young students borrow enough to obtain the government’s “minimum income guarantee”: most of the rest rely entirely on very limited amounts of grant (below £2,000 a year).


It is not clear how far non-borrowing students do not need all the help on offer, despite their very low declared family income, and how far they are not willing to use the student loan system, even if this causes severe hardship or makes participation unaffordable. As far as it is the latter, Scotland’s large reliance on living cost loans will be having some effect on widening participation, not least among those groups least able to live at home (including many from rural areas and those from troubled or poorly-housed families).   The Commission should consider whether some improvement in grant is needed to address this.


(ii) Information about loans

Debt aversion may be an absolutely unavoidable in some students. However, it is possible that the relatively large numbers of non-borrowing low-income students is partly a function of the poor quality of public debate and education about student loans in Scotland. The Scottish Government has greatly increased its reliance on student loans (now exceeding £0.5bn a year) while maintaining a rhetoric which discourages students from seeing these as a safe way of funding their higher education. For example, speaking on his last day in office, the previous First Minister said:


As somebody who had a modest upbringing in a council scheme in Linlithgow, whose parents in an atmosphere of both free education and full grant, scrimped and saved to send four children to university, I know what a challenge and what would have happened with the imposition of large debt to people like myself.


This contradiction between policy and rhetoric is unhelpful and those most likely to be damaged by it are those from low-income backgrounds who are deterred from entering higher education because they are fearful of taking out a student loan or who attempt to rely entirely on grant to fund their studies, when they cannot rely on family support in cash or kind. Assuming that the government has no plans to reduce its reliance on student loans, the Commission should address this point.


(iii) Living cost support away from home


Living cost support for Scottish students living away from home is relatively low compared to the rest of the mainland UK for students at incomes between £17,000 (£19,000 from this autumn) and £45,000. This would empirically be expected to be having some impact on participation, again particularly among those less able to live at home. It may also be limiting the HE choices of lower-income students. A family income in the £20,000’s remains relatively low. The Commission should consider whether the support for students living away from home is adequate at incomes just above the threshold qualifying students for maximum support.


(iv) Investment choices

In 2013-14, every £1,000 per head of fee funding for students in the top half of the income distribution cost the same to the cash budget as the government’s entire spending on grants (£65m in each case). That figure may also be compared with the £25m per year (£100m over 4 years) recently announced by the Scottish Government for the “Scottish Attainment Challenge” fund. The Commission may also wish to examine how £65m compares with the total spending on access-related initiatives, if it has access to that information.


Given how budgeting works within government, it is very hard to believe that the political priority given to saving higher income students from incurring any debt at all for their fees has not had a knock-on effect on the funding available for more targeted investment in the education and support of young people from disadvantaged backgrounds.


The Commission’s remit appears to take universal free tuition as a given: however, it would do a great service to the access debate in Scotland if the Commission were at least to make a clear statement on whether it believes the present model of universal 100% cash funding for tuition in Scotland plays an active part in promoting wider access (and if so, by what mechanism and on what evidence it bases that conclusion). Given the sums at stake, and the limited availability of cash resources to the Scottish Government, the Commission should also assess the relative benefit in terms of widening access of cash funding the whole fee cost for all students compared to spending elsewhere in the education system.

(v) Long-term equity

My research concentrates on the distribution of debt amongst students. In Scotland, the arrangements for student funding are unique in the UK in assuming the highest levels of student debt amongst the poorest students. This pattern is also reflected in actual borrowing, again uniquely in Scotland. Low-income students are more likely to borrow than those at higher incomes and on average will borrow more.


The Scottish Government tends to respond to any criticism of debt distribution in Scotland by quoting the Student Loans Company’s figures for final average borrowing across the UK. These figures are misleading, concealing that since 2013 low-income degree students in Scotland face much the same level of debt as their counterparts in the other devolved administrations, and in some cases more, while students from higher incomes in Scotland have the lowest debt of any group in the UK and in many cases are still able to leave university with no debt at all.


The Scottish arrangements are building up a regressive sharing of student debt in the Scottish graduate population. Those who started with least will end up owing the government most. This has implications for social justice in the long-term and the embedding of inequality over the generations. Those least able to rely on family help through immediate support or inheritance are those who will also have to forego the most from their salaries in future, reducing their relative capacity to pay for housing, pensions, childcare or other costs. This is simply unfair. It is not a widening access issue as such. But it raises the question of whether the cost of widening access is expected to be covered disproportionately by deductions from the future earnings of those from poorer backgrounds. The Commission should consider this point.

The identification and scaling up of best practice

Research undertaken in England suggests that locally-provided additional institutional bursaries are not especially effective in supporting wider access: see An interim report: Do bursaries have an effect on retention rates (OFFA publication 2014/02) and Have bursaries influenced choices between universities? (OFFA publication 2010/06). OFFA is currently undertaking further research in this area, following the changes introduced in 2012.

More generally, OFFA has invested in considerable amounts of research into widening access good practice, which the Commission should systematically review.

The data and measures needed to support access and retention

The figures collected by SAAS on the take up of student support should be used much more to monitor changes in the student population and student behaviour, particularly at low incomes. The SAAS data is particularly useful because by definition it covers all those students benefitting from government support in HE, whether at university or college.

The figures currently published do not:

  • distinguish between the poorest and the most well-off students in the income-related table;
  • provide data on the take up of the “minimum income guarantee” – figures on this have had to be obtained through further questions;
  • more generally, provide data on the take-up of grants, fees and loans, and total living costs support, by different levels of grant entitlement.

Also, more use could be made of systematic analysis of changing trends in grant take-up. For example, the total number of students on income-related grants fell between 2012-13 and 2014-15 by 1.9%, from 51,515 to 50,560. It would be useful to see this trend analysed and explained.

The Commission should consider how more use could be made of SAAS data by government and how more information could be published as standard.

Other comments

The timing and relatively short period for this evidence gathering exercise is likely to mean that many people with a useful perspective will have been unaware of it or unable to respond in time. It is welcome that the Commission has taken steps to ensure that its interim report can be informed by evidence from this exercise. However, to be sure of tapping existing expertise properly, it would be good if the Commission were to undertake a further evidence gathering exercise on a longer timetable which did not overlap with the school holidays.

The Scottish Widening Access Commission: a remit not to challenge too hard?

When the Scottish Widening Access Commission was announced last year by the FM,  its creation could hardly have been more prominent.  Announcements about it were made by the FM in November and February, with further ones by the Cabinet Secretary in March (to announce the appointment of the chair) and April (to announce its members).

Since then, there have been some significant developments in relation to the Commission, but oddly none of them appear to have been announced  to the Parliament or the press.  To find out about these, readers need to track down the Commission’s website.

First, the Commission has put out a call for evidence by 20 July.

It has also announced an additional member, Conor Ryan, now Director of Communications and Research at The Sutton Trust, but also a former senior Special Adviser to David Blunkett and Tony Blair (he once listed the first as his best friend in politics and the second as his political hero). Seen in his time very much as an adviser specialising in communications and presentation, his article for the Evening Standard “How the Bury the Truth” on tricks of the spin doctor trade includes as advice – rather beautifully in this context –  “Learn to use the internet. Not for education and home shopping, but to make facts public with nobody knowing you have done so”.

The Sutton Trust is a serious presence in the access debate in England and Ryan should bring to the debate not only access to its extensive research, but also a usefully different perspective: he is the only member other than the chair not working in Scotland.  For example, on student funding, he argued before the last UK election that “Reducing the levels of debt for less advantaged students should be a priority of any review  [in England]” – the relatively higher debt for poorer students in Scotland continues to be ignored or played down by many in Scotland – and that where resources are tight, means-testing fees should be a higher priority than reducing them for everyone: see 20 November 2014 post here.

Last, the remit has been finalised: see here.

Much longer than that outlined in previous PQs, the new remit still makes it clear that this is a body whose starting point is, as the Chair puts it elsewhere, that

This is a nation that knows how to do [widening access] and it is this good work that has laid the strong foundations which will enable us to not only widen participation but also to deepen it. 

It’s always good to go through the verbs in the remit of any body, because these are, quite literally, its” doing words”.  In this case, the result of that is [emphasis added]:

Building upon the Government’s commitment to free tuition fees for higher education, the introductions of Curriculum for Excellence, School Attainment Policy, reforms to the Post-16 education system and  Developing the Young Workforce programme, it is proposed that the Commission on Widening Access will:

  • synthesise existing evidence around barriers to widening access and retention, and their effective removal, for those from deprived backgrounds and, within this, identify any specific barriers for those with different equality characteristics or those from a care background;

  • propose both a short and long-term target for participation in higher education and clear milestones, to drive further and faster progress to widen access

  • identify best practice on widening access across early years, schools, colleges, universities and employers, and make recommendations as to how best practice on access and retention can be scaled up and embedded,within the work of individual institutions, across the wider education and employment system

  • identify the data and information required to monitor and support improvements on widening access across all education providers, and recommend the processes necessary to support this

The Commission – strikingly – has not been given the task of making recommendations to government about its own policies.  It is only being asked to make recommendations about process for data collection and scaling up local best practice, and to propose targets.  Everywhere else it is tasked simply with reportage, which is clearly to be done within the framework set by various existing government policies.

What if one barrier turned out to be  how fundamental aspects of school and curriculum organisation limit the subjects certain children can do and thus their potential access to higher education, particularly at certain institutions or for certain courses?  Or the relatively low and unpredictable bursaries in further education are having a negative impact? Or the lack of any national structure for facilitating articulation from college to university beyond tightly defined local partnerships tends to limit certain young people to certain institutions? Or the need to apply to university on the basis of predicted grades rather than actual ones privileges young people from schools which tend to predict high? Or the shift of FE colleges towards providing full-time qualifications for 16-19 year olds has reduced the opportunities for those who try to get back into the system with relatively poor qualifications later?  And so on.

None of these could necessarily be tackled simply within the scope of  “scaling up and embedding best practice”. None of the things above may be issues, but it would be astonishing if Scotland was getting it so right that the important barriers are all due to the failure of schools, universities and employers to copy widely enough good things already being done well on a small scale. What about tackling things we might actively be getting wrong, perhaps on a large scale? The underlying assumption of the remit’s authors seems to be that there’s no place for such a challenging thought, particularly if it relates to recent government policy.

How far the Commission reads its remit narrowly or broadly will be fascinating to watch and  will play a large part in  how radical its suggestions are and,very probably, how far its work brings about a significant shift in access to higher education for people from disadvantaged backgrounds.


A grant increase which is one-off – or not?

Last month the Cabinet Secretary for Education announced an increase in bursaries of £125, for all students with incomes below £24,000.

The SAAS website has now been updated to reflect this – but here’s an odd thing.  It says (emphasis added):

The amount of bursary you can get will depend on the household income in your permanent home.

Bursary and loan details
Household income Bursary Loan Total
£0 to £16,999* £1,875 £5,750 £7,625
£17,000 to £23,999* £1,125 £5,750 £6,875
£24,000 to £33,999 £500 £5,750 £6,250
£34,000 and above £0 £4,750 £4,750

* This includes a one off payment of £125 which will be available to these students in early 2016.

So this is not a conventional grant increase. Instead, in January the students affected will get a “one-off” extra payment.  I don’t think there’s ever been anything quite like this done in the grant system.  Usually any grant increase is simply built in from the start of the year.

Why the government is going to the extra trouble (and potential confusion for students)  of a stand alone payment is unclear.  Specifically, when it is described as a one-off, does this mean this is just a payment being made this year, but might not be repeated? That might explain why SAAS is not going to the trouble of updating its basic systems. But in fact that can’t be it – last month’s press notice says (emphasis added):

Thousands of students from the poorest backgrounds are to receive more financial support over the coming years under plans announced by the Scottish Government.

Bursaries for higher education students from Scottish households with an income of up to £24,000 will increase by £125 from academic year 2015/16.

Maybe it’s still come too late to be programmed into the system safely.

And why wait till “early 2016” and not give it to students sooner, when it might come in handy, particularly for the 28% of students who only claim their grant and decline any loan, most of whom almost certainly live at home and who might find it useful to help pay for an annual season ticket or a new student railcard (£120)?  The only good defence for the delay would be that this is the absolute soonest SAAS can bolt this on.

The late announcement of this extra amount  was already pushing the boundaries of conventional behaviour round student grant.  This aspect of the handling adds a whole new twist.

The new Scottish Rate of Income Tax, the council tax freeze and student grant: how they connect

As discussed here, the Scottish Parliament’s Finance Committee is currently gathering evidence on how the new Scottish Rate of Income Tax should be used from April next year.  More on the SRIT here.

In this submission to the committee (SRIT for Finance Cttee June 2015), I argue that the immediate priority should be making good the loss of tax revenue due to holding the council tax at the same cash level since 2007-08.

The Scottish Government is providing £560m to councils in 2015-16 in lieu of lost council tax revenue (rising to £630m next year if the freeze continues). Something originally planned as short-term has grown into a large spending commitment in its own right, costing more than free personal care.  While the benefit of the freeze to individual council tax payers is clear, its cost is hidden. The Scottish Government’s description of the freeze as being “fully funded” obscures that the policy carries a large cost in spending lost on other things.

The spending is likely to have been lost from a mixture of services outside local government and general funding to councils, whose total funding from central government has fallen, despite the growing element identified as funding the freeze.  The cost of the freeze in lost public spending, particularly on local government services,  will tend be falling disproportionately on the poorest, while the largest benefits  fall disproportionately to the better off (many of the very poorest see no benefit from the freeze, due to the Council Tax Reduction – the replacement for council tax benefit).   The biggest gains in absolute terms have fallen to residents in Band H  properties in Aberdeen (which has the highest council tax).  They are closely followed by Band H dwellers in Glasgow, Dundee and Midlothian. Band  H properties are those worth over £212,000 in 1991:   0.5% of properties now fall into this group. Looking at the distribution of properties across the bands and the impact of Council Tax Reduction brings out that a minority of households in higher-valued properties receive rather more than half of the total benefit of the freeze in absolute terms.

There are parallels here with the disproportionate impact on poorer students of the move away from grant to loan to support living costs, at the same time as free tuition has commanded most of the attention (and resources) and been by far the more visible element of policy to the better-off.

Using additional income raised through the SRIT explicitly for the purpose of funding the cumulative effect of the council tax freeze would immediately release £560-630m for additional spending on public servicesincluding – the submission argues – up to £100m on improved student grant. It would also recognise that there has been a loss to the total tax base, clarify the link between the freeze and its real long-term cost and mean that cost is borne more fairly, while a long term solution to local taxation in Scotland is worked out (currently the task of the Commission on Local Tax Reform).  The submission also converts spending on various elements of student funding into an equivalent cost in SRIT – current spending on grant is the equivalent of around 0.15p on the income tax rate, while every £1,000 per head of funding for tuition works out around 0.3p.

It is not very likely that this suggestion for a dedicated levy is going to get very far.  Arguably, however, the first £560-630m of any extra income from the SRIT will always in effect be replacing lost council tax revenue, if any government chooses to put the rate up from its fiscally-neutral starting point – whatever the official presentation.

The Committee’s deadline for submissions on the SRIT is 28 August.


Missing the bigger picture: why applications statistics need context

A case study of how looking  in isolation at one set of improving figures – applications to university from the most deprived areas in Scotland – makes it easy to miss important questions for the debate about widening access.

In particular, concentrating on the numbers applying to university from poorer backgrounds – often a focus of reporting in Scotland – doesn’t tell us how far extra applications are translating into extra actual students.  There’s little achieved in encouraging more people to apply if their academic track record means they will stand a thin chance of getting a place or if the system doesn’t have space to accommodate them, and application figures alone tell us nothing about whether the system is getting better at recognising the potential of students from disadvantaged backgrounds.  Looking at figures from only one part of the UK – whichever it is – also limits what can be learnt.

Application rates from disadvantaged areas in Scotland since 2006

Yesterday the Scottish Government drew attention to a new UCAS analysis showing that, amongst the SIMD quintiles,  the largest percentage growth in applicants to Scottish higher education since 2006 has been in the most deprived group, in which the rate of application rose by 50%.  As a result, UCAS reports that the gap in the rate of application between the least and most deprived groups has closed over the decade.  Those from the least deprived are areas now 3.5 times likelier to apply than the the most deprived, compared to 5 times more a decade ago (a 30% fall in the ratio).

These are numbers going in the right direction, but they come curiously lacking any context.   It is not a standard UCAS publication but a piece of one-off analysis and the press notice does not explain what or who has prompted it.

It has most probably been produced at someone’s request to support the  work of the Commission on Widening Access.  The existing UCAS analysis for 2014 uses POLAR  classifications as the measure of deprivation, while Scottish policy is based on  SIMD, so there’s sense in checking how the two compare. However, looking at the resulting set of figures in isolation tells only a small part of the story.

Application rates across the UK

For example, these figures cannot be compared with changes in other parts of the UK, for which only POLAR data is available.  Fortunately, the new UCAS note includes a footnote showing how the SIMD results produce similar results to those obtained using POLAR classifications: that may turn out to be one of its most useful conclusions, indeed.

The UCAS application data for the POLAR3 Q1 across the UK over the decade looks like this:

POLAR3 Q1
2006
2015
Increase
England
12.20%
21.00%
72%
Northern Ireland
18.70%
25.40%
36%
Scotland
9.60%
15.60%
63%
Wales
13.60%
18.90%
39%
UK
12.30%
20.70%
68%

(Table 15/16 here)

For applicants from the most deprived backgrounds from Scotland,  using POLAR in fact produces a larger growth (63% rather than 50%).  The increase is higher than in Wales or Northern Ireland, but a little lower than in England.  The first question then is how well do we understand why the patterns are so distinct in different parts of the UK (access initiatives? demographics? changes in the school system?).  Some of the common assertions about student finance and fees – so often cited as critical  – look oddly irrelevant here, when the two most improved systems are the one  with the highest fees and most debt (England) and the one with free tuition but also unexceptional total living cost support and low grant (Scotland).  For all the political, media and academic interest in widening access, it still feels as though far too little opportunity is taken to investigate what is driving different effects in different parts of the UK.

Closing the gap in application rates

On closing the gap in application rates between the most and least deprived, the POLAR figures for Scotland again show a similar change to those for SIMD (a 33% rather than 30% fall in the ratio), with England and Scotland once again the parts of UK seeing the most improvement.

Ratio Q5:Q1 2006 2015 % fall
England 3.8 2.4 37%
Northern Ireland 3.1 2.5 19%
Scotland 4.5 3 33%
Wales 3.3 2.5 24%
UK 3.7 2.4 35%

(As above)

Entry rates

The new UCAS note looks only at applicants, which provides a valuable measure of young people’s changing aspirations.  However, UCAS also produces data on entry rates, and this is important, because these tell us more about who actually gets to university.

Using POLAR data, the entry rate for the most deprived group has risen by 49%, lower than the 63% increase in  applications.  At first sight that suggests  that the increase in  applications is not fully translating into an increase in entrants: however, a different POLAR measure is used here – POLAR2 – which may explain the difference.  It is a missed opportunity therefore that the new UCAS report does not also provide the entry rate on SIMD terms, to see if the same effect occurs if measured that way.

2006 2015 % change
England 11% 18% 61%
Northern Ireland 12% 17% 49%
Scotland 6% 9% 49%
Wales 12% 17% 39%

(From here: table 71)

England sees the highest rise in entry rates, but as in Scotland it is lower than the increase in applicants in this group: Wales sees no difference and Northern Ireland (intriguingly?) sees a larger improvement in entry rates than applications.  So using different POLAR measures does not consistently pull the figures in any particular direction. Still, at first sight something interesting seems to be happening in the Northern Irish system – they look to have become better at converting applicants from disadvantaged backgrounds into entrants (despite having a tight cap on numbers within Northern Ireland itself).

Maybe the lower growth in applicants from this group in Northern Ireland means that those who do apply tend to be better-qualified and that increases their success rate.  Could fixing too hard on increased applicants as a measure of success risk tying up increasing numbers of young people in a process where they have a limited chance of  success, for the sake of a making the system look more successful than it is, when it comes to providing actual opportunities? Comparative data doesn’t answer such questions, but it helps them get asked.

Closing the gap in entry rates

Turning to the gap between the entry rates for the least and most deprived, this has closed in Scotland at a similar rate as it has for applications.  That still suggests that the progress in closing the gap in actual entrants  may be largely down to changes in applications.  How far have success rates for applicants from deprived backgrounds changed? How is that pool changing? Perhaps mostly fundamentally, does an applicant with a particular set of qualifications from a deprived background have any more chance of being accepted than they did 10 years ago, compared to one from a better off background?  Looking at application figures in their wider context doesn’t directly tell us the answers but, again,  helps form the questions.

 Ratio Q5:Q1 2006 2015 % fall
England 3.83 2.53 34%
Northern Ireland 4.11 2.59 37%
Scotland 5.46 3.54 35%
Wales 3.62 2.57 29%

(As above: table 73)

The comparison of change in application and entry rates may mean less than first appears and be due to use of POLAR3 for one and POLAR2 for the other: but the comparison brings out the importance of analysing what  has changed – or not – at each stage in the system.

Conclusion: seeing the bigger picture

Any new data here is potentially useful.  But in this case the absence of any comparative context – whether with  other parts of the process or other parts of the UK – makes this document on its own less useful.    There is progress here to be celebrated – but concentrating on Scotland-only figures, for just one stage of the UCAS process, carries the risk of failing to look at the operation of the whole process from application to  entry, as well as reducing the scope for some critical distance from policy-making and practice in Scotland.  It is not that some positive reporting isn’t justified,  just that it is not the whole story, in important ways.

Responding to the new UCAS analysis, the Cabinet Secretary said “It is important that the [Widening Access] Commission has access to a full range of evidence”. That must be right and is a good reason why this new analysis is worth putting in a broader comparative context. In particular, while rising applications from disadvantaged young people are a necessary element of widening access,  we  need to get more cautious about what these statistics alone can tell us.