Graduate employment and Scotland/UK comparisons: less of a case for celebration than first appears?
Perhaps prompted by yesterday’s report from the CIPD, Universities Scotland tweeted today about graduate employment levels in Scotland and including comparisons with the UK.
The two sets of figures highlighted are:
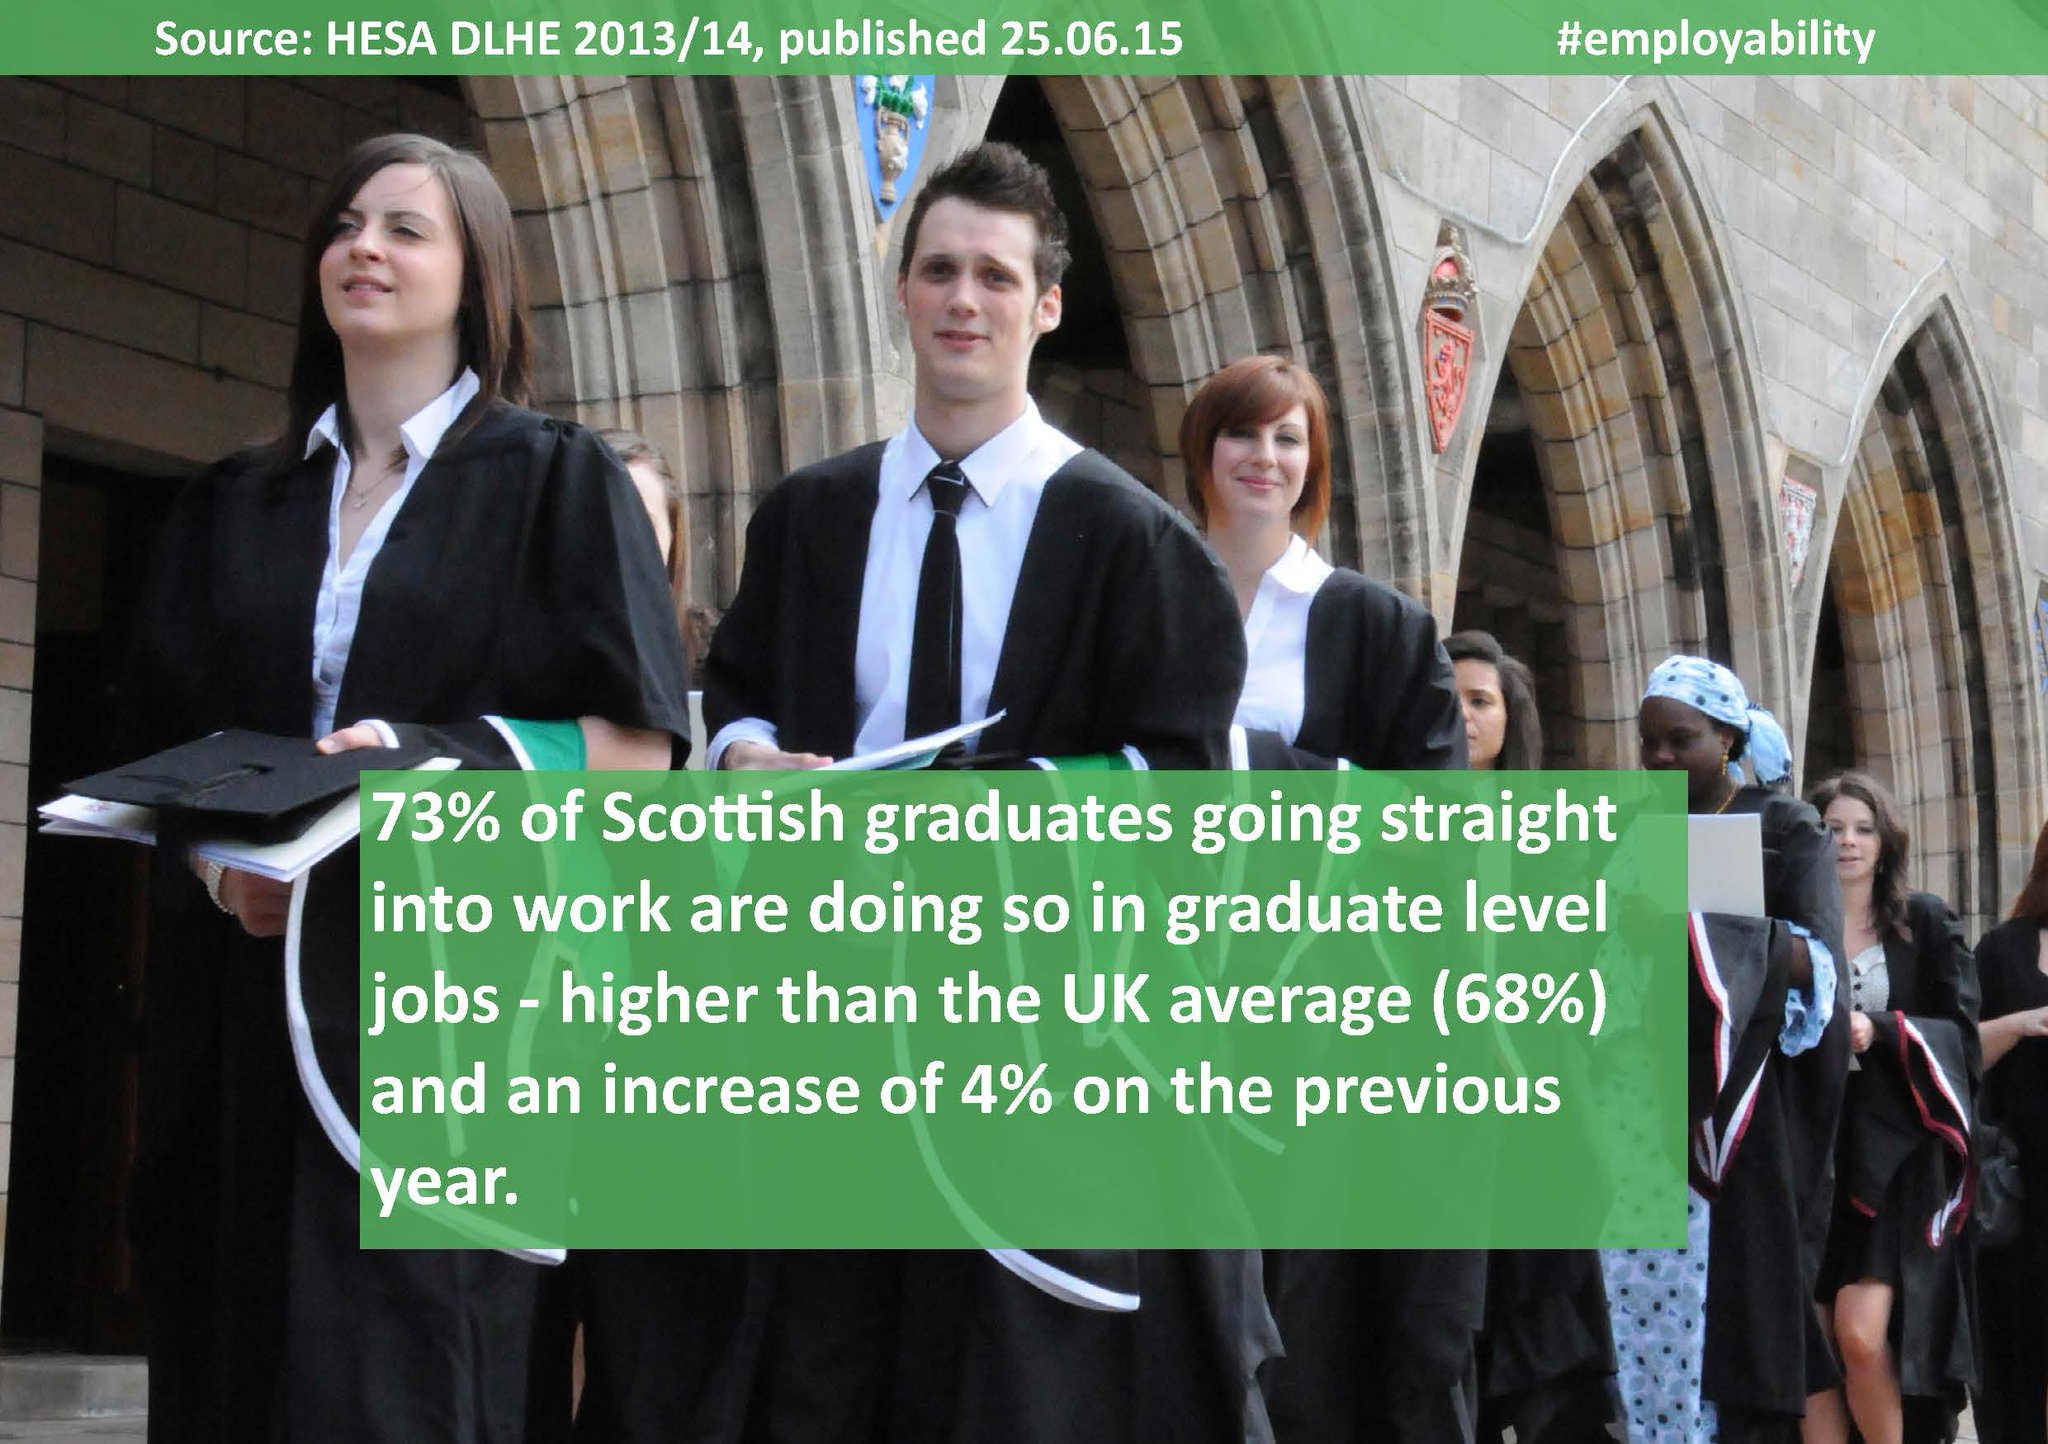
73% of Scottish university graduates going straight into work secure graduate level jobs (UK avg 68%) (here)
89.9% of Scottish university graduates are in positive destinations of work or further study (UK average 88.8%) (here)
A question prompted by comparisons of post-graduation employment is how far this may reflect differences in the social background of the graduates leaving university in different parts of the UK. There is research to suggest (not very surprisingly) that employment success after graduation has a relationship with social background on entering university: for example, this recent report from the Social Mobility and Child Poverty Commission. So any university system which had a more socially selective student population would be expected to have better post-graduation employment rates.
Could UK/Scotland comparisons be affected by this? The graduate employment figures from HESA quoted cover all UK and EU students, so any analysis for comparative purposes needs to look at that whole group, not only those from Scotland. The 73% quoted above is for former full-time students, so again any comparison of intake might be reasonably limited to those. For both Scotland and the UK, the figures only cover HEIs, so HE in FE colleges can be ignored for this purpose.
The relevant group for the June 2015 stats will be 2014 leavers, who mostly started university in 2010 or 2011, so HESA’s “performance indicators” on access for new full-time entrants in those years is a good place to look: see here. Those figures give percentages for the UK and for Scotland for students (a) from state schools and (b) from National Statistics Socio-economic (NS-SEC) classes 4 to 7 (see footnote 2). The PIs only cover young students, but it would take a large inter-country difference in the profile of full-time older students to change the general picture, so these are at least a good place to start.
The figures suggest that the difference in post-graduation employment rates between Scottish HEIs and the UK as a whole may be explained in whole or part by differences in intake. In these years Scotland took a slightly lower share of its students from state schools than the UK as a whole and there was a larger gap still in the proportion of students entering HEIs from NS-SEC classes 4 to 7. The differences are pretty similar to differences in graduate employment outcomes.
Full-time young degree entrants (Tables T1a)
| 2010-11 | 2011-12 | ||
| State school entrants % | Scotland | 88.3 | 87.9 |
| UK | 88.7 | 88.9 | |
| NS-SEC4,5,6,7 % | Scotland | 27.2 | 26.6 |
| UK | 30.6 | 30.7 |
The purpose of this post is not to discourage Scottish universities from celebrating the success of their graduates in finding work. However, the comparison with UK employment rates is regularly used by Universities Scotland and by Scottish Ministers (for example, here) to imply the Scottish system works better for students. Before these comparisons are used again, the ball is in the court of universities and government to demonstrate that slightly better employment outcomes here than in the UK as a whole aren’t accounted for in large part by a slightly more socially advantaged intake.
If there are more sophisticated deconstructions available of differences between different parts of the UK which look at how HEI intake affects graduate employment, I’d be happy to update this post to include links to any that readers want to highlight.
Footnote 1:
HESA summarised the figures in June as below:
Key Points – Scotland HEPs only
In 2013/14, there were 35,680 leavers from HEPs in Scotland whose destinations were known (34,860 in 2012/13). Of these, 64% (22,965) were in UK employment (64% in 2012/13), 5% (1,625) were employed overseas, 6% (2,115) were in work and further study, 15% (5,340) were in further study, 5% (1,770) were engaged in other activities and 5% (1,860) were unemployed (6% in 2012/13). (Ref. Table 2a [xlsx 21 KB], Table 3a [xlsx 21 KB] and Chart 9.)
In 2013/14, there were 20,740 full-time first degree leavers whose destinations were known (20,555 in 2012/13), 65% (13,490) were in UK employment (64% in 2012/13) and 6% (1,160) were unemployed (6% in 2012/13). (Ref. Table 2a [xlsx 21 KB] and Chart 9.)
For Science subject areas 70% of full-time first degree leavers were in employment (either in the UK or overseas) and 5% were unemployed. For other subject areas 66% were in UK or overseas employment and 6% were unemployed. (Ref. Table 4a [xlsx 44 KB].)
In 2013/14, of the full-time first degree leavers who were employed in the UK, 73% were in posts classified as Professional employment (69% in 2012/13). The remaining 27% were working in occupational groups classed as non-professional. (Ref. Table 5a [xlsx 28 KB].)
In 2013/14, of the 1,800 part-time first degree leavers whose destinations were known, 77% (1,385) were in UK employment and 3% (45) were unemployed. (Ref. Table 3a [xlsx 21 KB] and Chart 9.)
Of the 3,865 other undergraduate leavers (both full-time and part-time, excluding foundation degree) whose destinations were known, 42% (1,645) were in UK employment. Of the 8,455 other postgraduate leavers (both full-time and part-time, including Postgraduate Certificate in Education) whose destinations were known, 69% (5,860) were in UK employment and a further 9% (770) were employed overseas. (Ref. Table 2a [xlsx 21 KB], Table 3a [xlsx 21 KB] and Chart 9.)
In 2013/14, of those UK domiciled, first degree leavers (both full-time and part-time) reported as being in full-time paid employment in the UK, 62% disclosed their salary. The median salary reported (to the nearest £500) was £22,000. The lower quartile was £18,000 and the upper quartile £26,000. The mean salary was £22,500. (Ref. Table 6a [xlsx 17 KB].)
Footnote 2:
HESA explains that
The information on socio-economic classification is taken from the National Statistics Socio-Economic Classification (in technical terms, HESA field SEC). The classifications used are:
1 Higher managerial and professional occupations
2 Lower managerial and professional occupations
3 Intermediate occupations
4 Small employers and own account workers
5 Lower supervisory and technical occupations
6 Semi-routine occupations
7 Routine occupationsThe UK performance indicator is the proportion of students from NS-SEC classes 4 to 7 out of those from NS-SEC classes 1 to 7. NS-SEC class 8, long-term unemployed or never worked, has been included with unknown classification for the purposes of the UK Performance Indicators.
For the 2008/09 academic year, UCAS changed the question that informs NS-SEC which affected the majority of applicants for entering in the 2008/09 academic year. The question reverted back to the original wording for 2009/10 applicants.
For applicants up to and including the 2007/08 academic year and for the 2009/10 academic year, UCAS asked:
“If you are under 21, please give the occupation of your parent, step-parent or guardian who earns the most. If he or she is retired or unemployed, give their most recent occupation. If you are 21 or over, please give your own occupation.”
For applicants for 2008/09 entry, the question changed to:
“If you are in full-time education, please state the occupation of the highest-earning family member of the household in which you live. If he or she is retired or unemployed, give their most recent occupation. If you are not in full-time education, please state just your own occupation.”
The change in question had an impact on the NS-SEC indicators, causing the proportion of students classified as unknown and those classified as falling into NS-SEC groups 4 to 7 to rise in 2008/09. Although the question reverted back in 2009/10, there may still be a slight impact on the NS-SEC indicators resulting from applicants who applied using the 2008/09 form and deferred entry. Given these differences and the lack of any significant external changes to the system, it is safe to conclude that the change in question means that the NS-SEC data for 2008/09 is not comparable with that published prior to and post 2008/09. The 2008/09 NS-SEC data has been labelled as age-adjusted NS-SEC and it is not recommended to include this data in any time series analysis. As a result, the 2008/09 NS-SEC data has been published separately in tables T1ai, T1bi and T1ci and labelled as age-adjusted NS-SEC.
Related
From → Related topics


Comments are closed.