UCAS applications 2019: cross UK comparison
The latest UCAS applications data got some coverage last week highlighting differences in trends between Scotland and other parts of the UK (for example https://www.scotsman.com/education/university-applications-by-18-year-olds-dip-slightly-in-scotland-1-4963636). There was an argument over whether the sharper rise in those from the most deprived areas in England (+6%) than Scotland (+3%) meant anything and what the relevance was of the higher numbers in Scotland who do an HN qualification at college without passing through UCAS, before going on to university.
These figures look at the demand for places, not who gets in. What do they show?
Cross-UK comparisons in general
Over the years, people (including the SG, which this week was arguing comparisons cannot be made) have used cross-UK comparisons of UCAS numbers to claim certain things are proved about HE policy, specifically decisions on student funding. Cross-UK comparisons are tricky: but they are not impossible, for the reasons discussed here https://wonkhe.com/blogs/comment-scottish-english-access-must-be-compared/ .
Number of 18 year olds applying
I don’t like comparing this, because there is no control for underlying year-on-year variation in the size of the age 18 population. So I won’t.
Age 18 application rate
This is a much more useful thing to compare, because it controls for fluctuations in the number of 18 year olds in each nation.
Comparing the absolute values still hits the college-level HE problem: there are people who will eventually go on to university in Scotland who are missing from these numbers.
The trend over time is the thing to focus on. It gives a decent comparable measure of how the proportion of young people interested in going straight to university from school has changed. The way age is measured by UCAS takes into account that school leavers tend to be a bit younger in Scotland (so there are relatively few under 18s in the Scottish data).
The most recent age 18 application rate figures from UCAS look like this:
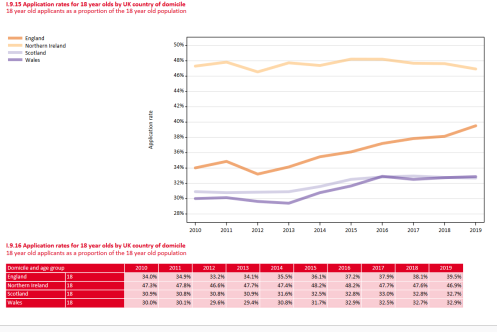
Beware: the y (vertical) axis doesn’t start at zero, so this graph at first glance exagerates relative change over time.
Even so, it’s a pretty clear story of a flat line in levels of interest in Scotland and Wales, and a slight drop in Northern Ireland, since 2016, but a steady increase in England since 2016 (and longer, but 2016 is where the divergence becomes clear).
We cannot tell how far the proportion of 18 year olds applying to college in Scotland has risen or fallen over the period (no data is collected centrally on college applicants), so the invisible Scottish line which includes all applicants to any kind of HE could either have risen or fallen over the period. All we can tell is that applications for direct entry to university in particular have remained static.
If you were inclined to think that any specific detail of funding systems has less impact than is often asserted on whether school leavers will apply to university, this would be Exhibit A. Whether you were to look at total fee debt, total debt (including for living costs), the value of grant, the upfront value of all forms of living cost support (loan plus grant) or changes to the repayment terms for loans, you would struggle to find an explanation in policy variation across the UK over time for the differences between these lines.
Why the application rate for students in England has risen so consistently and unusually, even as the amount of debt involved has grown, is an obvious question. We don’t have the age 18 entry rate by region within England: the absolute numbers suggest there could be substantial variation in that, and exposing that might help isolate non-funding factors (exam results? the economy?).
Of course, effects from one or more funding changes could be being off-set by other factors. But if that thought were to be combined with the common belief that high fee/high debt systems are generally bad for demand from young people, you’d need to ask what was going in England which means the increase would have been even greater, if different funding rules had been in place.
None of this tells you what student funding policy should be, or that funding is completely irrelevant, but it does suggest simple causal arguments about the relationship between funding, particularly individual elements of that, and demand from school leavers should be avoided.
Applicants aged 19 and over
It’s harder to control for demographics once you look across other ages. The way the numbers are provided means extracting this is is fiddly, so this table only compares 2019 with 2018.
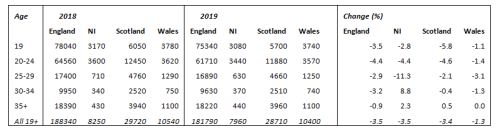
The number of applicants aged 19 and over has fallen in every UK nation: by around 3.5% England, Northern Ireland and Scotland, and by 1.3% in Wales. The number of 18 year olds has been falling for a while, so the drop in 19 year olds and 20-24 year olds is likely to explained in part by that. That Wales has not seen such a fall in under 25s might be due to less acute demographic change: but if it is not that, the recent changes to student funding there might be relevant. There have been some signs from other data that older students are more sensitive to changes in funding regimes. But then Wales doesn’t have a clear advantage in students over 24, so that’s not an argument that I’d want to push too far.
The particularly large drop in 19 year old applicants in Scotland again could be down to differences in demographics. If not, it’s a bit puzzling, not least as any increased use of UCAS to record college to university moves, as has lately been encouraged, would be expected if anything to cushion the figures for that group.
Students from disadvantaged backgrounds
This year, for the first time (I think) UCAS has published figures based on the Index of Multiple Deprivation (IMD) produced for each nation. Each IMD is different in its detailed construction, but they all measure multiple disadvantages at the level of small areas, rank these areas and then group them into 5 bands (quintiles), from the most to least disadvantaged. Quintile 1 covers the 20% of most disadvantaged areas. The figures here are still not strictly comparable between nations but they ought to be better than previous cross-UK measures for comparing by area type. The SG’s long-standing line, used again this week, that UCAS’s measures of disadvantage in different nations are comparing different things now feels a bit out of date.
Area measures do not tell us directly about individual disadvantage and it could still be that the relationship between area and individual disadvantage varies by nations (perhaps low income people are more concentrated in multiple disadvantage areas in one nation compared to another, for example).
Still, area disadvantage in the Scottish Government’s benchmark for success in widening access so it is not off the wall to compare these numbers.
The percentage change for 18 year olds and for all applicants in each nation by IMD quintile is shown below, along with the overall change in the age 18 population, for context.
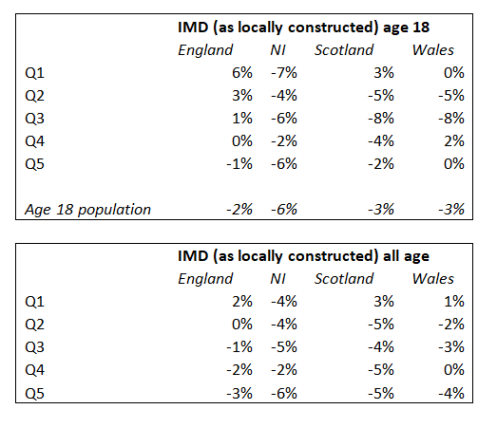
The press association story linked above compared the +6% in Q1 in England for 18 year olds with the +3% in Scotland. The age 18 population has dropped a bit more here, but not enough to explain the gap.
It’s imperfect, but I think it’s reasonable to say that over the last year applications from school leavers direct to university from the most disadvantaged 20% of areas have risen faster in England than Scotland. Wales and Northern Ireland both look less good again. Scotland has a particualrly sharp cliff-edge between Q1 and the rest. This may reflect the recent intense policy focus on Q1 in Scotland.
Across all ages, things look better for Scotland compared to England in IMD Q1, though less good outside those areas, including in Q2. Again the cliff edge between Q1 and the rest is much sharper in Scotland.
A wider point is that single year comparisons are generally less revealing than those looking over a longer period, so a further piece of work could use the IMD figures going back further, and control for changes in the number of 18 year olds over a longer time.
Conclusion
UCAS is the nearest thing we have to a measure for demand for university places. With the move to publishing IMD figures for every nation, our abilty to compare groups of applicants by area type, at least, has improved. An application rate at 18 for each IMD quintile in each nation would be even better, because that would remove any remaining demographic effects.
Even allowing for all the limitations, these figures show that:
- over recent years demand from school leavers has grown faster in England than in other parts of the UK;
- in the past year at least demand from school leavers has grown faster in the 20% of most disadvantaged areas in England than in Scotland (and Wales and Northern Ireland are both further behind);
- the fall in applicants aged 19+ over the past year is negligibly different between England, Northern Ireland and Scotland, but Wales fell less; and
- in the past year Scotland saw faster growth, relative to the other nations, for applicants in total, of all ages, from the most disadvantaged 20% of areas, although both for 18 year olds and all ages the cliff edge in the year-on-year change between Q1 and other area types was especially sharp in Scotland.
Comparing IMD figures over several years would reveal more.
UCAS numbers remain a dubious basis for making claims about the inherent superiority or inferiority of any nation’s student funding system. Still, something has stimulated faster growth in demand from school leavers, specifically, including those from the most disadvantaged areas, in England since 2016. What that might be, however, is a whole other question.
Note on data
All data available here: https://www.ucas.com/data-and-analysis/undergraduate-statistics-and-reports/ucas-undergraduate-releases/applicant-releases-2019-cycle/2019-cycle-applicant-figures-30-june-deadline
Change in the total number of 18 year olds in each nation extrapolated from the application rate and absolute numbers in 2018 and 2019.


Comments are closed.