Student support review #7: more trouble with comparisons
This post adds a substantial new item to the list of problematic ways the recent review of student support in Scotland has invoked cross-UK comparisons. In this case it has done so by ignoring half the relevant Scots and getting some figures for the other devolved nations wrong.
If readers sense a degree of exasperation at the game of comparative whack-a-mole associated with this report, they would be right. It’s a distraction from what really matters – but it’s that very distracting quality which makes it hard to ignore.
Debt at low incomes across the UK
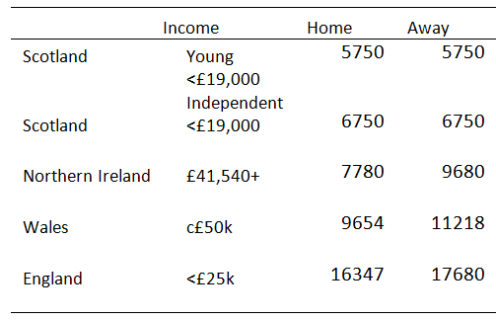
The report of the student funding review as originally published on 20 November contained this table (at page 30), which appears to rank UK nations by the amount of total debt expected for students on the lowest incomes, living at home.
Source: Student funding report as originally published 30 Nov 2017
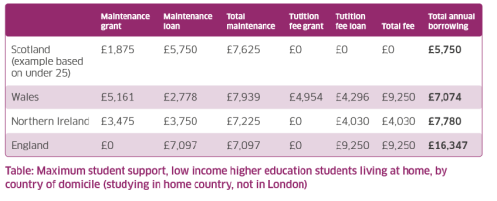
Something looked immediately wrong: at the launch, I quietly alerted the review team to the Welsh fee figure being too high (it should be £9,000, and thus the total debt £6,824): the on-line version has since been corrected for this. But more generally the figures looked too high to be the “living at home” rates – Wales and Northern Ireland especially caught my eye.
Coming back to this more slowly, I turn out to have been wrong about Wales, where I’d failed to keep up with this year’s increase. But the Northern Irish figures are indeed well out. Northern Irish maintenance debt is shown at double the correct amount for those on maximum support, and total debt is therefore overstated by £1887. See Footnote 1 below.
This is not the most fundamental problem with this table, however. There is a greater flaw which becomes clear on re-reading. It only shows the figures applying for Scottish students classified as “Young”. It omits those Scots treated as “Independent”, who have higher expected debt.
Ignoring this group is very hard to defend, if your aim is to give readers an accurate picture of how the Scottish system compares with others for those at the lowest incomes, because independent students will be around half of all those entitled to maximum support: see Footnote 2. They will include many of the people facing the most challenging immediate financial circumstances.
Indeed, as the report notes on page 40, even the description in the table is not quite right, because some students under 25 are classified as independent (the report notes those with children, those who have been self-supporting for some time; other examples include those living with a partner: page 53 here.)
I feel bad that I didn’t immediately spot this omission, even skimming an 84 page document while also trying to listen to the presentation.
Assuming the final report was actually cleared by the group, I’m completely baffled as to how fourteen people who had spent a year reviewing student support managed to agree a document containing a table purporting to make cross-UK comparisons for low income students which missed out half that group in Scotland. The separate arrangements for young and independent students in Scotland are laid out, without commentary, 4 pages earlier in the text.
The table corrected
This is what happens if the Northern Irish and Welsh figures are corrected, and Scottish independent students welcomed back into the fold of those we care about enough to mention. New or changed figures in bold.
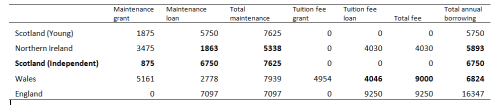
And look. Young Scots still have least debt, but the Northern Irish leapfrog Independent Scots. It ceases to be true that Scotland always has the lowest debt for those at the lowest incomes: it depends on your age and other things. Also, the figures for all four groups of students in the devolved nations are more obviously closely bunched.
A fair-minded person should point out here that the low debt in Northern Ireland is achieved by not giving students nearly as much to live on. But applying that logic, as Northern Ireland slips down the table, Wales jumps to second place: borrowing there is £74 higher than for independent students from Scotland, but total maintenance support is £314 more.
Whichever way you look at it, low income independent students in Scotland – half the membership of the “maximum support” group in Scotland – borrow more than those in one of the other devolved nations.
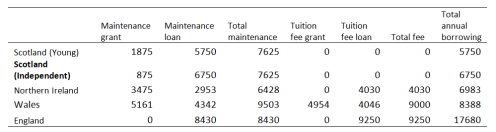
Perhaps it’s different if you look at the rates for those living away? Those are arguably more important to compare. Young and independent students from Scotland do then both have less total debt than all the rest: but the “Wales problem” persists – low income students from there borrow £1638 more than Scottish independent students, but have £1878 more to spend as a result (see Footnote 3).
Why is the table included?
The table is included to back up this statement (emphasis added):
Before describing our recommendations, it is important to understand the context of student loans as they currently operate in Scotland, including comparisons with other parts of the United Kingdom.
Currently Scottish students studying undergraduate higher education courses in Scotland are at an advantage over other students in the rest of the United Kingdom. This is partly because they do not have to pay any tuition fees which are funded by the Scottish Government. As a result, the total maximum annual borrowing of students in Scotland is lower than elsewhere in the United Kingdom, as shown in the table below:
The highlighted statement is actually true: the trouble is that the table above doesn’t show maximum annual borrowing, it shows the borrowing associated with getting the maximum support. These are not the same.
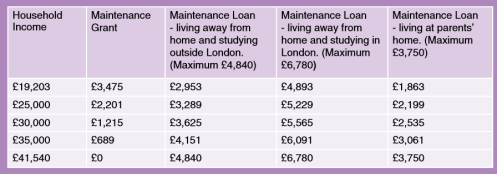
In Northern Ireland and Wales debt rises as income rises. The maximum debt is incurred in Scotland and England at the lowest incomes, but in Northern Ireland debt is at its highest once income reaches just over £41,000 and in Wales it peaks at incomes of around £50,000 (see Footnote 4).
Thus, the table that matches the words does give Scotland an unambiguous place at the top of the league table. But it also inconveniently brings out that Scotland currently shares with England a system designed to indebt the most those who start with least, and that Wales and Northern Ireland don’t.
The importance of being careful
Oscar Wilde’s Lady Bracknell comes to mind.
To lose one parent may be regarded as a misfortune; to lose both looks like carelessness.
Just taking this table on its own terms and ignoring the dislocation from the text, it:
- overestimated the debt in Wales a bit (just enough, as it happens, to affect the comparison with Scottish independent students)
- overestimated debt in Northern Ireland spectacularly
- omitted the c50% of Scots on maximum support who face the highest debts
The first of these I raised privately with the review team on 20 November, thinking it was one minor error. I spontaneously said then I wouldn’t mention this as a criticism (accidents happen), and I am sorry now to break that promise. But it turns out to form part of a pattern of errors and omissions which all tend the same way. Collectively, these result in a table showing a sharper distinction in annual borrowing between Scotland and the rest of the UK than justified. That’s before even getting into the 3 year/4 year degree issue, about which the review says nothing.
The Welsh fee level for in-country students in 2017-18 has been public knowledge since September 2016 (if you remember seeing something about it going up by £295, that was a plan for 2018-19, abandoned in mid-October). The Northern Irish arrangements are set out in this leaflet. None of this required so much research to get right. A government-sponsored review could always have run the figures past the other governments, indeed.
Part of larger picture
This comes on top (see here) of
- a straightforwardly incorrect claim in the report that Scotland currently has the best loan repayment rules in the UK; and
- a claim that it will do so in the future, which is far from self-evident, and requires detailed substantiation which isn’t provided.
Indeed, immediately after the table discussed above, the report includes another comparing loan repayment rules between Scotland and England, omitting Wales and Northern Ireland, and commenting only on the element where Scotland has a more favourable regime than England (interest rates) and saying nothing about the two elements it shows (repayment threshold and write-off period) where it doesn’t.
All this comes after a claim used in the PR round the report, but not the report itself, that the review’s recommended model is superior in a more general way to UK systems, which I think the review team struggled to back up when asked, putting it kindly: but you can judge for yourself – see here.
What’s going on?
The review has proved itself to be rather fonder of making superlative comparative claims about the funding position in Scotland than in presenting the evidence needed to support them.
Any of these, and other things besides, may be relevant:
- The review’s Finance Sub-Group consisted only of Scottish government officials and the Chair (end of Annex E here: all the other review sub-groups had at least a few other members of the main review group). The full group met 8 times that we know of, with the 7 meetings for which minutes are available lasting one hour: see here. Opportunities for the review group to explore collectively the financial assertions put to it look to have been limited.
- Related to this, it seems likely the report had to be cleared by members very quickly, if indeed the final text was seen by everyone, which I start to wonder about: small signs of this include typos in the heading of the table discussed above.
- The Scottish government likes these kind of comparative claims. The review may have been concerned to package its findings in ways which offered Ministers potentially appealing lines (I will mention again the hiring of Charlotte Street Partners to do media work around the launch of the review).
- The review may have been relying on others to provide it with information or briefing it didn’t have the capacity to check: I see more and more signs this process was under-resourced.
- What it was given by others just wasn’t right, for whatever reason – anything from deliberate skulduggery (I would hope not) to simple error (never under-estimate the scope for simple error in government). However, errors always look more accidental if they don’t all tend the same way: I worry especially about that grey zone, where a figure isn’t properly checked, because it feels like what you want to be true.
- Related to that, collective belief in Scotland just being best, because… well, just because. We have free tuition. Our ministers are good at giving heart-felt speeches about fairness. Look, how much do we really need to check the numbers?
Whatever explains it, the result is the same: a mild air of triumphalism which obscures hard-to-defend elements of the system, in this particular case, that some of the most financial vulnerable and disadvantaged students in Scotland are given even less grant and more debt than others. On the young/independent difference, the review
- includes a table showing the difference between independent and young students on page 26, but at no point discusses this difference,
- makes a general statement on page 40 that “The Board considers it important that both independent and estranged students are treated in a similar way to other groups of students”, but
- recommends on page 12 an option involving no change to any of the current levels of higher education bursaries.
Ah.
Conclusion
I am getting fed up with unpicking questionable comparisons. I certainly didn’t expect it to be such a large part of assessing the findings of an independent review. It is just very disappointing. Does it matter? I think so, because I reckon it fosters political (and official?) complacency and the dismissal of uncomfortable evidence.
I’d prefer us to look at the Scottish system in its own right and ask what’s the best we can do now, with what we’ve got? The review was a chance to dig deep, to look at ourselves honestly in a brightly lit mirror, to move the debate out of rhetorical flourish and onto more substantial territory, drawing on solid evidence, where needed. To stop using what other people are (or at least are asserted to be) doing to deflect scrutiny of the full effects what we are choosing to do ourselves. To use comparisons to help our understanding about the range of choices and their consequences, not to play down difficult features of our system.
Thus, to repeat, we give those coming into HE from the lowest income households only £1,875, or even just £875, in non-repayable grants and ask them to borrow the rest of what they need to live on. We could easily give them more grant, but we prefer to use that money to keep the children of the professional classes out of any debt whatsoever for fees (and often, therefore, any debt at all). And we use UK comparisons to reassure ourselves – apparently – that that’s OK. “Best”, even.
Once upon a time, I wrote a report on student funding in Scotland, including some analysis of the use and abuse of comparisons. I called it “The Fairest of Them All?” and ended it with an extract from The Emperor’s New Clothes. Old stories of power, blind eyes and difficulty with unwelcome truths seemed resonant. The report noted:
The evidence gathered here and the arguments drawn from it may be uncomfortable and counter-intuitive for some readers … In [Andersen’s] story, of course, the townspeople eventually allow themselves to admit the true position. In Scotland, where the most advantaged sections of society are currently sitting very comfortably, it is harder to predict how the story will unfold.
This review was an opportunity – however constrained – for some of the great and the good (no-one likes being called that, but any review members still reading will have to bear with me on this as being a reasonable description of most of them) to use their independent standing and collective voice to encourage the telling of a new, more self-critical type of story, which consistently put the treatment of the most financially vulnerable at its centre.
Only NUS Scotland, who the report noted pressed for a higher grant option at least to be costed and included, and has called the current system “broken”, seems inclined to stir things up. But generally the old narrative of “bestness” evidently still holds considerable appeal.
Footnote 1: Northern Ireland
The Northern Irish arrangements are clearly summarised here (p12).
Someone seems to have seen a reference to a “maximum loan” of £3,750 in NI for students living at home but failed to appreciate that this amount is only a starting point. Actual loan entitlement depends on the amount of grant a student receives: “if you receive a Maintenance Grant, we will reduce the amount of Maintenance Loan available to you” as the leaflet puts it. The system has worked this way in Northern Ireland for years. The table in the Scottish report shows a combination of maintenance grant and loan that never occurs in the NI system.
In exceptional cases, a rule is applied where students get the full amount of grant and it does not reduce loan. Then, the grant is reclassified as “special support grant”: for technical reasons, this reduces problematic interaction with the benefit system, in cases where that is relevant. This system is used in NI, Wales and England and the review report indeed recommends in a different section that Scotland should consider adopting it too. You could argue that the NI loan figure is therefore OK because this combination of grant and loan would hold for a student on special support grant: but it would be a heroic line to take, as then the Welsh figures would also need to be changed, for consistency, the table heading (“maintenance grant”) would be wrong and the comparison would exclude most students from low incomes in these countries.
Footnote 2: Independent students as % of those on maximum support
[Updated 4 December: minor wording changes to make clearer, in response to a question from a reader]
The official statistics (Table 8) record 17,890 students on Independent Student Bursary (ISB) in 2016-17. ISB was only available to those declaring household incomes below £19,000.
The other means-tested bursary, Young Student Bursary (YSB), was claimed by 31,220 but this includes some students on less than the full rate of YSB, and therefore not entitled to maximum level of total support. They come from incomes between £19,000 and £33,999.
The statistics (Table A6) also show that 24,915 students who received either type of means-tested bursary declared an income of less than £19,000, and a further 10,515 received the max bursary without being required to demonstrate the precise level of their low income. There’s a further group of 1,580 who weren’t asked to demonstrate their income, but got less than the full bursary: I suspect this includes quite a few people who dropped out mid-year. The best available estimate of those falling within the group entitled to maximum support is therefore 37,010.
On these rough assumptions, those on ISB accounted for 48% of all those on the maximum rate of support. This calculation is a bit rough, but near enough for “around half” to be used as a reliable description.
Footnote 3: Away rates
The table below reworks the one published, but uses the rates for those living away from home.
Footnote 4: Maximum borrowing
The students facing the maximum borrowing are those from the lowest income households in Scotland and in England. In Northern Ireland, borrowing is highest for those above the cut off for grant. In Wales, borrowing peaks at around £50,000: this is the point where grant entitlement stops and before some loan entitlement is further withdrawn, under the system currently used there.


Comments are closed.