“Brexit Blamed for Fall in EU Students”: should it be?
[Posted 29 November and updated, as marked, 30 November]
A press release issued yesterday by Jeane Freeman (SG Minister for Social Security, but acting here in her capacity as an MSP) was headlined “Brexit blamed for fall in EU students”. The press release accurately noted that UCAS had identified Brexit as a likely factor in the 4.4% fall in applicants to UK universities from the EU in 2017 and argued (emphasis added):
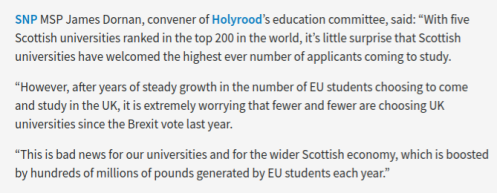
it is concerning that the UK has become an increasingly less popular destination for EU students since the Brexit vote last year. This is bad news for our universities and for the wider Scottish economy, which is boosted by hundreds of millions of pounds generated by EU students each year.
The Tories’ increasingly insular approach to the world and the endless uncertainty they have created for EU citizens living here in Carrick, Cumnock and Doon Valley is damaging the UK’s reputation, our economy and future prosperity, and the SNP will do all in its power to protect EU citizens in Carrick, Cumnock and Doon Valley and continue making Scotland an attractive place to work and study.
The same highlighted line was used verbatim by the convenor of the Scottish Parliament’s Education and Skills Committee to The National.
I suspect those highlighted words will be seen again.
How safe it is to assume that a fall in actual EU students (as opposed to applicants – see below) is mainly due to Brexit? Surprisingly, it is possible to take a reasonable stab at answering this, and the answer is almost certainly “mostly not”. Most of the fall appears to be due instead to something mysterious going on this year in Scottish universities.
Applications vs applicants vs actual students
There are three sets of numbers here
- Applicants – the figure which has dropped by 4.4% across the UK – are the individuals interested in attending university.
- Applications are the number of different approaches these people make to universities (in 2016 and in 2017, the average number of applications per EU applicant was just over 4).
- Then there are those who have a successful application. The measures discussed here are “placed applicants” and “acceptances“. These are both defined by UCAS as someone who has been “placed for entry” into HE: “acceptances” is used once the admissions cycle is complete.
The last is the nearest we have to actual students (not identical, as some placed applicants may not actually show up, and some may somehow bypass UCAS, but it’s very close). This is the group that matters if you are interested in the effect on the economy.
The UCAS press release notes the fall in “placed applicants” from the EU in UK universities is at 2.1%, around half the fall in applications. It is still a fall, however.
EU applications, applicants and acceptances across the UK
This week’s UCAS figures only provide some UK-wide totals, so it’s necessary to look at some earlier numbers to get an idea of the variety of underlying patterns across the UK.
The tables at the foot of this post give the most recent data we have on EU applications and placed applicants in different parts of the UK this year, from June (for applications) and September (for placed applicants). UCAS doesn’t appear to publish nation-by-nation data on EU applicants (surprisingly, I may be missing it) [Update 30 Nov: I was, but it doesn’t change the picture – note added atfoot of post], so I’m using changes in applications as a proxy: the ratio between the two appears reasonably stable across the two years at UK level, which is the only level at which I can measure it.
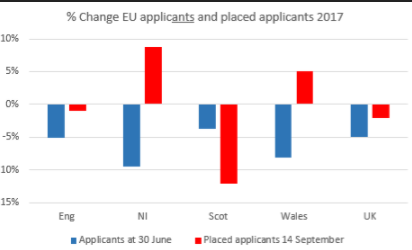
At the level of the four UK nations the best data we have at present suggest that changes in actual placed applicants this year bear little relationship to changes in applications.
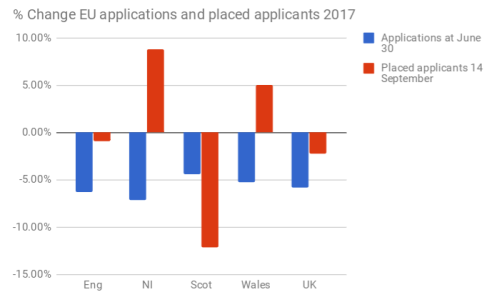
Applications fell in Northern Ireland and Wales, but placed applicants rose. In England, placed applicants fell (by 1%), but by substantially less than the fall in applications.
In these three nations, universities appear to have become more willing to accept applications from the EU, off-setting the fall in applicants. The total fall in placed applicants across the rest of the UK as at 14 September was 130 or 0.5%.
By contrast, Scotland saw the smallest fall in applications but much the largest fall in placed applicants. Uniquely in the UK, Scottish universities appear suddenly to have become (much) less willing to accept applications from EU students, taking 560 fewer or 12.2% less.
As a result, Scotland accounted for 85% (560/690) of the drop in placed EU applicants in the UK, as known in September.
Of course things could have changed since then. But this week’s UCAS figures record a UK total of 30,540 EU acceptances, compared to 29,850 placed applicants in September, an increase of 2.9%. It would have taken some extraordinary re-shuffling in the last few weeks to change the general picture above.
Brexit … or something else?
Brexit affects the whole of the UK. Something else seems to be going on here, specifically affecting Scotland.
Maybe EU students applying both to Scottish and rUK universities have had just as many offers as ever from Scotland, but for some reason this year have been more likely to turn them down in favour of ones from institutions in the other UK nations. I’m pretty doubtful about that, but for now it remains a theoretical possibility.
Far more likely is that Scottish institutions have become less likely to make offers to EU students. This might be system wide, or an effect concentrated in those institutions which recruit most heavily from the EU.
There’s an obvious reason why this might have happened. Universities in Scotland are subject to new government targets to widen access, but the system is not being expanded, because the policy of free tuition makes it expensive for the Scottish government to put in more places. To admit more people from disadvantaged backgrounds, universities must either therefore admit fewer Scots from less disadvantaged postcodes, or take fewer entrants from the EU, the other group who qualify for funded places (rUK and overseas students are irrelevant to all this).
Over the past year or so, there’s been quite a lot of concern expressed about the potential for the “displacement” of students from less disadvantaged areas to accommodate growth in those from more disadvantaged postcodes. That the acceptance rate (the success rate for applications, in effect) for 18 year old Scots has dropped to a historic low in recent years has also become more widely known. In addition, EU students cannot count to the achievement of the new SIMD-based access targets (as SIMD is a Scottish area measure) but in some circumstances may be counted in the baseline of all home students: when/if that happens, their recruitment will automatically dilute the achievement of access targets.
So the big drop in EU admissions specifically in Scotland this year could be due to a change in admissions practices across the sector which has reduced the likelihood of EU students getting an offer. One possibility suggested by someone who knows more than me about the technicalities of admissions (not hard) is that more places are being filled by unconditional offers, which tend to go to Scots, leaving fewer for conditional offers, apparently commonly used for EU students.
If that’s what’s going on, most of the fall in actual EU students in the UK this year would have nothing to do with Brexit and everything to do with the pincer effect of two Scottish policies – free tuition (and thus capping) and the drive to widen access.
Is this good or bad?
Ms Freeman and Mr Dornan are concerned at the economic impact of the loss of EU students.
However, Ms Freeman, and the Scottish Government, have both welcomed the 2.4% (850) increase in Scots admitted to university this year, most of which appears to have been enabled by taking fewer people from the EU.
So there’s a tension here, explicit in the full Freeman statement. The SG, perhaps more alert to the two-sides-of-same-coin issue, has not made the same argument about the fall in EU numbers (as far as I have seen).
Conclusion
We need to see the final figures next month for EU applications and acceptances by UK nation to confirm the pattern in the summer/autumn data.
However, though a fall in applicants may be attributable to Brexit, at the moment something quite different – the response of universities in Scotland to the interaction of the Scottish government’s fee and access policies – appears more likely to be driving most of the fall in actual EU university entrants this year across the UK.
Update
After writing this I found this story, which includes this quote from the Minister for Employability and Training, Jamie Hepburn.
Scotland’s Minister for Employability and Training Jamie Hepburn said ministers were “deeply concerned” by the fall in applications, which he blamed on the Government’s decision to pursue a hard Brexit outside the single market. “While Scotland fares better than England when it comes to attracting EU domiciles, it is still worrying to see this decrease in applicants, the damaging reality of Brexit,” he added.
It turns out to be based on an SG newsrelease (emphasis added)
It has to be said that while we welcome international students from out with the EU we are deeply concerned that these latest statistics also show a decrease of 4% in the number of applicants from the EU. While Scotland fares better than England when it comes to attracting EU domiciles, it is still worrying to see this decrease in applicants, the damaging reality of Brexit. We are urging the UK Government to ditch their hard Brexit model which will no doubt have a hugely negative impact on areas such as Higher Education, not only in Scotland but also in the rest of the UK.
So the tension between deploring a drop in EU students and welcoming the rise in Scots made possible by that goes right to the heart of the official government position.
Data
Table 1 EU Applications at June 30 https://www.ucas.com/file/115926/download?token=Qs0vX0tF
| Change | |||
| 2016 | 2017 | % | |
| Eng | 169130 | 158540 | -6.26% |
| NI | 3210 | 2980 | -7.17% |
| Scot | 47570 | 45490 | -4.37% |
| Wales | 8010 | 7590 | -5.24% |
| UK | 227920 | 214580 | -5.85% |
Table 2 EU Placed applicants at end of clearing (14 Sept in 2017) https://www.ucas.com/file/125616/download?token=YiT_YQ-M
| Change | ||||
| 2016 | 2017 | Nos | % | |
| Eng | 24200 | 23970 | -230 | -0.95% |
| NI | 340 | 370 | 30 | 8.82% |
| Scot | 4610 | 4050 | -560 | -12.15% |
| Wales | 1390 | 1460 | 70 | 5.04% |
| UK | 30540 | 29850 | -690 | -2.26% |
Table 3 Percentage share of the fall in EU placed applicants between 2016 and 2017 (from Table 2 above)
| Eng | 35.38% |
| NI | -4.62% |
| Scot | 86.15% |
| Wales | -10.77% |
Change between September and November EU placed applicant/acceptance figures (all UK) comparing total from Table 2 and figures from page 7 https://www.ucas.com/file/135626/download?token=pQL3AOVK)
| 2016 | 2017 | Change: nos | Change: % | |
| Sept (placed applicants) | 30540 | 29850 | -690 | -2.26% |
| Nov (acceptances) | 31350 | 30700 | -650 | -2.07% |
| Nov as % Sept | 102.65% | 102.85% |
EU Applications (as at June 30) per applicant (as reported at end of cycle): all UK
(from Table 1 above and figures p6 https://www.ucas.com/file/135626/download?token=pQL3AOVK)
| 2016 | 2017 | |
| Applicants | 53560 | 51185 |
| Applications | 227920 | 214580 |
| Applications/applicant | 4.3 | 4.2 |
Update for EU applicant data by nation
I missed this UCAS note which gives EU applicants by UK nation as at 30 June.
https://www.ucas.com/file/115901/download?token=bzdJIyHR
The changes are similar as for applications and produce the graph below, which closely ressembles the one for applications, above.


Comments are closed.