Has the average grant payment fallen by £400 over the past decade?
Last week, the Scottish Labour Party highlighted recent cuts to grants with this tweet.
This post checks the £400 quoted and concludes that the real terms fall has been nearly double that (and as much as £899, if looking specifically at Young Student Bursary). As well examining Labour’s claim, the figures here also provide some context for the current review of student funding, which is due to report towards the end of this year.
Sources
The last year before the SNP came into government was 2006-07. Data on student funding over the period is available here: 2015-16 is the latest year for which average payments can be calculated. The relevant data and my calculations from it are here: Grants 2006-2015.
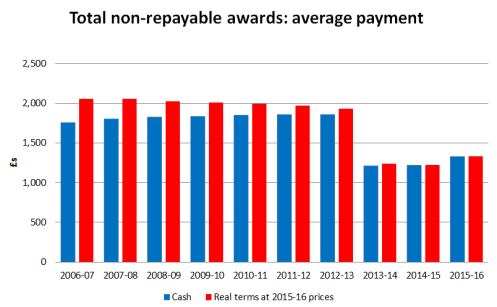
Total non-repayable funding (grants and bursaries)
The £400 looks to be a calculation of the cash value of the change in the average value of all forms of non-repayable SAAS support taken together: this fell from £1,757 to £1,328 (-£429). However, these figures take no account of inflation. Given this comparison covers a decade, it would be more conventional to put figures into a common price base – to make them “real-terms”. At 2015-16 prices, the 2006-07 average would be worth £2,051, making the real terms fall over the decade larger (£-723).
 Young Student Bursary
Total awards is a useful figure, but looking at it masks larger falls in the grant targeted specifically on young low income students. For Young Student Bursary, the cash fall was from £1,914 to £1,336 (-£579). The real terms fall is larger. At 2015-16 prices, the average YBS payment was £2,235, so that the real terms fall in the average grant payment to a young student from a low income family was -£899.

As the charts show, the drop is almost all accounted for by the unpublicised cut made to YSB rates in 2013. The slight rise in 2015-16 reflects the addition of £125 to most but not all YSB entitlements.
Total numbers receiving non-repayable support and total spending
For the bigger picture, it’s also worth looking at changes in the total value of payments and number of recipients. The charts below show the real-terms value and number of claimants of (a) total non-repayable awards and (b) YSB alone. This shows that as well as the average falling, so did total spending, as did the number of students receiving non-repayable grants, and YSB alone. Yet total student numbers have risen over the period, and in 2013 a number of smaller grants covering just over 2,500 students were rolled into YSB.
The spike in the total in 2010 is due to mature students being brought back into a national grant scheme (albeit at lower rate than YSB): the fall in 2011 is due largely to the abolition of travel grants the year after.


Comments are closed.