The rise, fall and rise of student debt in Scotland and the contribution of different administrations to debt gaps within the UK
Scottish students tend to leave higher education with lower levels of debt than those elsewhere in the UK. Some of that will be due to the higher proportion of people here who only stay in the system for one or two years (mainly HNC/D students). Some of it may be down to a higher proportion living at home. But policy divergence has also evidently been a large part of the story.
Differences in debt are sometimes presented as specifically an achievement of the past decade, but the figures below suggest it’s been a function of devolution more generally.
The changing picture on final debt across the UK
Using this week’s figures on final student loan from the SLC, it’s possible to chart how debt has changed in Scotland over the past 17 years. It turns out to be a tale in three parts: rise, fall and rise again. It’s also possible to unpick exactly how levels of student debt in Scotland have diverged from those in the other UK nations
Disclosure: I was working as a civil servant on policy in this area between 2000 and 2004, specifically the implementation of the graduate endowment and Young Student Bursary. Readers will want to be aware of my background in reading this.
This chart shows the average final debt of students as they entered repayment in each year from 2000. There’s a time lag, so for example the 2017 figures relate largely to those who left HE in 2016. If they completed a degree, they will have entered no later than 2013.

The divergence between Scotland and other UK nations set in quickly after devolution in 1999.
It’s possible to identify three distinct phases in student loan change in Scotland. First there was a phase where debt rose, then one where it fell or barely changed, and one last one where it rose again.
The chart below shows the annual change in debt each year in each nation, separating into the rise/fall/rise periods for Scotland. 2000 is the earliest year covered by the recent SLC data.
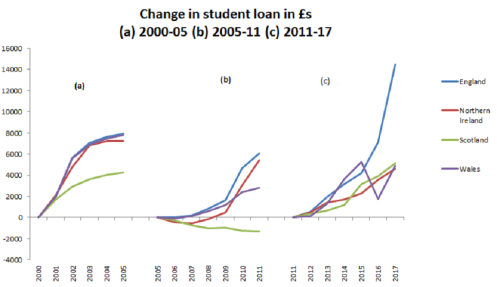
2000-05
From 2000 to 2005 final loan in Scotland rose each year. In the early years most students leaving had studied under pre-devolution arrangements. As time passed, more leavers had been under the “Cubie” arrangements brought in for new entrants in 2001 by the Labour/Liberal Democrat coalition. This
- reintroduced a grant for younger students called Young Student Bursary (grants were abolished UK wide just before devolution)
- abolished a means-tested annual upfront fee of £1,000
- introduced a single post-graduation payment (of around £3000 at current prices) for around half of students (in effect young students on courses of degree length: HNC/D students and all mature students were exempt).
- reduced the amount of maintenance loan available to those from higher income families.
The first one-year HNC students under these rules appear in the chart above in 2003, HNDs in 2004, 3 year degree students in 2005 and 4 year students not until 2006.
Over 2000-05 Scotland peels quickly away from the position in the rest of the UK, finishing at about half the debt level. Debt in the other UK nations rose much more sharply between 2001 and 2003, before leveling off. At this stage, all three other nations are very similar: Wales and Northern Ireland were following the English model (Wales didn’t have powers to deviate, Northern Ireland had other pressing concerns).
2005-2011
Having begun to flatten out by 2005, average final debt levels in Scotland then fell every year until 2011 (except in 2009, when they rose very slightly). In 2005, 2006 and 2007, those entering repayment were graduates of the Labour/Liberal Democrat scheme (or in a few cases, one of the pre-devolution ones). Grants had also been increased in 2005, reducing debt.
In 2008, those entering repayment benefited from the incoming SNP administration’s abolition of the graduate endowment in 2007. Debt continued on its the falling trend (other than the modest rise in 2009) up to 2011.
Over the same period debt in the other UK nations pulled away further, particularly in England and Northern Ireland, which both moved to a higher £3,000 fees (plus grant) system for new entrants from 2006. Most of these entered repayment in 2010. By 2009, the use of new powers in Wales shows in its less quickly rising line (grants were increased and fees limited).
The abolition of the graduate endowment contributed to a continuing downward trend in Scotland. However, the effect wasn’t enormous: average final debt fell by just under £600 (-8%) between 2007 and 2011. Most of the increased difference between Scotland and the UK by 2011 is accounted for by the decision by the Labour/Liberal Democrat coalition in Scotland in 2004 not to adopt the new £3,000 fee model brought in in England in 2006.
2011-2017
From 2011, final loan increased every year in Scotland. A finding that I hadn’t expected is that it rose by almost exactly the same absolute value in all three devolved nations (£5,150 in Scotland, £4,590 in Northern Ireland and £4,915 in Wales, though quite erratically). Only England, adopting a £9,000 fee for new entrants from 2012 broke away.
The rise here was due to the Scottish Government increasingly turning to loans to fund living costs, particularly after 2013, when substituted loan for one-third of grant and generally increased total loan entitlements.
How did loan end up so much lower in Scotland?
These charts unpick the process by which average loan in Scotland has departed from the levels elsewhere in the UK. It becomes clear that it has happened in these stages:
- active policy-making by the Labour/Liberal Democrat coalition – introducing the Cubie package – accounts for Scotland having around half the average debt of the the rest of the UK by 2005.
- passive policy making by the Labour/Liberal Democrat coalition – declining to follow the example in England, Northern Ireland and Wales of £3,000 fees – accounts for a further widening of the gap after 2009.
- active policy making by the SNP administration – abolishing the graduate endowment – has some effect but much less than the others here.
- passive policy making by the SNP administration – declining to follow the example in England of £9,000 fees – has a large effect on the difference with England, but none with that for Wales and Northern Ireland.
The difference in final debt levels is generally claimed as an example of the success of the current government in Scotland. However, it becomes clear that much of that difference is due to the position it inherited from previous administrations and that its own active contribution to that difference is a relatively small part of the story.
Its most substantial contribution to differences in debt has been not to follow the £9,000 regime in England. This is a wholly devolved area and no political party or civic Scotland body in Scotland has advocated this model, at least in public. So the main challenge facing the government in not following England has been in finding ways to pass to other parts of the budget any negative impact through Barnett of reduced spending on English universities. (It’s not clear how large a task this has been, however, as the SG is keen not place a cost of free tuition, some of the money saved in England may have been re-spent on other devolved areas, and no savings elsewhere have been specifically attributed to tuition fee policy).
Put briefly, these comparisons bring out that the difference in debt levels between Scotland and the other devolved nations is largely an achievement of governments elected in Scotland prior to 2007, and that the current government’s contribution to the difference with England is largely down to a decision not to use devolved powers to do something no-one here has ever asked it to do.
Footnote
Figures underlying the graphs here UK debt for blog


Comments are closed.