Trends in student grant across the UK, 2012-13 to 2015-16: England’s last hurrah, and Scotland still a cause for worry
This post uses data published yesterday to look at recent trends in student maintenance grants across the UK – claimant numbers, percentage of students getting one, total spending, and average amounts.
Grants will never attract the same attention as fees, but these numbers tell us about changes in cash support affecting students from the lowest income families, and also, with caveats, something about trends in the recruitment of this group. Comparing the situation across the UK brings out how different policies can have substantially different effects. How far Scotland is a guide to what lies ahead for England is a hanging question here.
A piece on here in October drew attention to the surprising fall, of almost 10%, in the number of low-income Scottish-domiciled students claiming a means-tested maintenance grant since 2012-13, concurrent with large cuts to student grants which took effect in 2013.
Figures published yesterday by the Student Loans Company for the other UK nations now allow the trends in Scotland to be looked at in a wider context. For consistency with the earlier post, 2012-13 to 2015-16 is kept as the period of interest.
In summary, things still don’t look any better for Scotland. There have been upwards trends in lower-income students in Wales and England since 2012-13 and Northern Ireland has seen only a small drop. However, the relatively positive picture in England is a swan song: grants have been abolished there for new entrants from this autumn, with consequences still to be seen.
Important note: these figures are sensitive to rule changes on qualifying thresholds. Wales and Northern Ireland saw no change to their thresholds over the period, or the run-up. In 2012-13, England reduced the upper income cut-off from around £50,000 to £42,620: that took a few years to work through the system, taking out a group of middling-high income households. Grant rates were cut by around one-third in Scotland in 2013-14 for all students (not just new entrants), but the upper income cut-off stayed round £34,000:the cut-offf or maximum grant fell from just over £19,000 to £17,000.
The tables underpinning these graphs are all here:grant-tables-dec-2016.
Numbers claiming
The population of 18 years olds is falling in every UK nation, but the number of students entering full-time HE has still risen everywhere. The graph shows the change in total claimant numbers relative to 2012-13: the absolute numbers are so much higher in England than in the devolved nations that the raw figures cannot sensibly all be put into the same graph.

The slight English fall in total grant claimants (-1.2%) reflects the tightening of the rules on qualifying levels of income. However, it conceals an increase of 5.5% in the number of those claiming the maximum grant (incomes up to £25,000). This was faster than for students as a whole (+3.6%), which looks like good news for access.
The similar overall fall in Northern Irish grant claimants (-0.75%) can’t so obviously be explained by changes in the grant rules. It has happened at the same time as a 4.0% increase overall in numbers: this looks like less good news for improving access.
The rise in Wales also can’t be easily attributed to changes in the grant rules. It reflects instead a general growth in student numbers, although in contrast to Engand the rise has been slower among grant claimants (+3.5%) than among students as a whole (+8.3%). The rise has been faster for those on the maximum grant (+4.4%, up to £18,300) than for those on incomes between that and £50,000 (+2.5%). There may be some purely technical reason for the particularly sharp increase in the numbers with incomes too high to claim a grant, but that’s not immediately evident from just looking at the grant system.
Only Scotland has seen a sharp drop (-9.5%) in grant claimants over the period, despite the cut-off point for receipt of any grant remaining the same, and all-income student numbers from Scotland rising at a similar rate as in England and Northern Ireland (+3.5%). This continues to look like a concerning (and now we can also say anomalous) pattern.
The Scottish data doesn’t allow a breakdown by grant level, except in the final two years: between 2014-15 and 2015-16, there was a fall in those on full grants (-4.6%, incomes up to £16,999) and on partial grants (-6.5%, up to £33,999).
Proportion of students getting a grant
The effect of different upper income cut offs on how many students benefit from a grant shows clearly in this graph. England’s and Northern Ireland’s cut-off points are very similar (around £42,000), Wales has the highest (£50,000) and Scotland the lowest (£34,000).
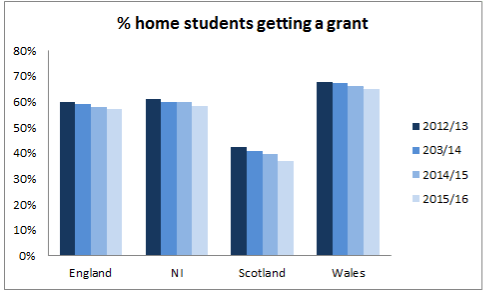
As long as the upper income threshold stays the same over time, changes in the percentage of students who get a grant within a nation should be a rough measure of changes in the compositon of the student body by income.
The graph shows that the proportion receiving a grant is not only lowest in Scotland but also that the percentage of the student body receiving a grant has fallen most here.
The percentage of students getting a grant has also dropped slightly in other places. But only in Northern Ireland is this due to an absolute fall in the number getting a grant. In England, as seen already, this is because the rules have been tightened at higher incomes, while in Wales, again as already seen, there’s been growth but not as quickly as at higher incomes.
Spending on grant
This is shown by comparison with 2012-13, as again the absolute number is so much higher for England that a single graph doesn’t work.
The largest rise has been in England, despite the reduction in the threshold, reflecting the growth in numbers at lower incomes. Spending in Wales has risen, but not by so much, reflecting the less rapid growth in low-income numbers. Northern Ireland has held roughly steady.
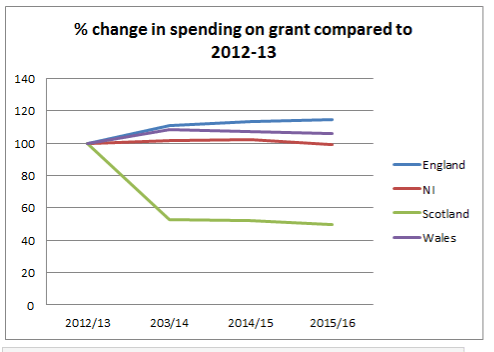
Scotland unsurprisingly stands out: the effect of the very different policy choice made here to withdraw substantially from targeted support for low-income students becomes very clear.
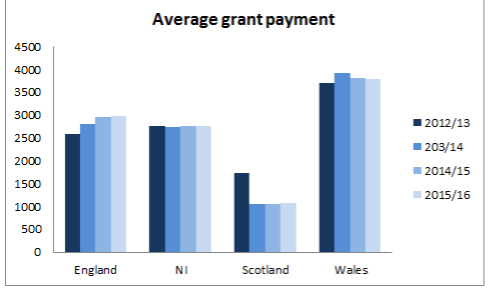
Average grant paid
Again, the figures here show how Scotland has the lowest grants, and the effect of the cut in 2013-14. In Northern Ireland average payments have held pretty steady. Wales has seen a slight rise. England’s steady and more substantial rise reflects how the composition of the grant-taking group has shifted towards those entitled to a full grant.
Of course, just as England was developing a positive story to tell on grant, and very probably the particularly strong recruitment of students from the lowest incomes, it pulled the plug. Policy-makers in England who want to tell a good story on widening access must be hoping that Scotland’s rapidly-falling numbers on low-income grants since 2012-13 are not a sign of what lies ahead for them.


Comments are closed.